5Mon·

Traders in demand - double bottom trend reversal


Hello, to the traders/chart technicians out there.


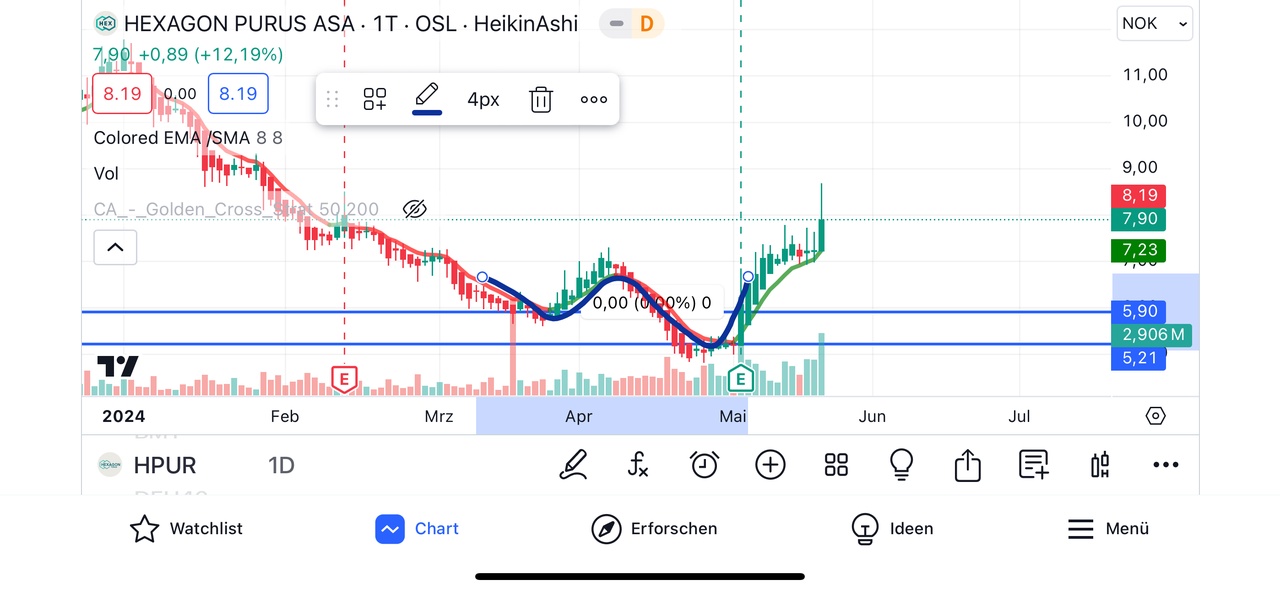
A quick question about the interpretation of a chart. Can you identify $HPUR (+4.16%) a double bottom/ a "W" formation between March 22nd and May 2nd or is it not possible because the difference between the bottoms is too big?


For me it would be a slightly shifted "W".
attachment
5 Comments

profile image
Why does the share in the chart cost €7.90 and the one you linked to cost 0.79 cents🤔
And no no double bottom no W formation simply a downward trend that is broken
Show answer
profile image
@Barsten It's totally random that I'm writing to you here. Is it possible to write to you via another platform? I have a question. 😬
View all 2 further answers
Join the conversation