Especially for @DonkeyInvestor and @MarketNewsUpdate 🔥
Are renewable energies really subsidized more than other energy generation methods?
For those with little time on their hands, no.
Fossil methods such as coal and gas, as well as nuclear power generation methodology, are subsidized far more than renewable energy generation.
Long version (incl. "a few" numbers)
For those interested, check out this 2017 study on pre-2017 numbers.
Probably some will find the information frightening.
But how high are the current subsidies in electricity prices?
Across Europe, nuclear energy was subsidized to the tune of 35 billion euros in 2011, while power generation from coal and gas was subsidized to the tune of at least 26 billion euros - in total, much more than renewables, which were subsidized to the tune of 30 billion euros. (At least according to a draft of the EU -. https://docs.google.com/file/d/0B9F6ub8wD7gqUVBPVEdvWG9WRWs/view?pli=1&resourcekey=0-TgxZGGAFCFAUFVb2GeG_6g)
But the figures were removed from the report, according to the "Süddeutsche Zeitung," because they were "never secured," according to the Commission. (Here is the link to the document: https://docs.google.com/file/d/0B9F6ub8wD7gqQW9vNGtidHZVaUE/view?pli=1&resourcekey=0-KLcXKAslhMWQZfVr1vEVQQ)
The fact is that any subsidies in the energy sector were never limited to green power.
The DIW justifies this with history. In Germany, coal was subsidized to maintain jobs, regardless of economic viability.
With nuclear energy, there have just always been subsidies and one did not want to deviate from this, because the currently cheap nuclear power would otherwise massively increase prices.
To put it simply:
Nuclear power can be so cheap due to subsidies because the final storage, disposal, maintenance and any risks are borne by society.
(You could also call it socializing costs and privatizing profits.... But then you're an evil socialist 😉)
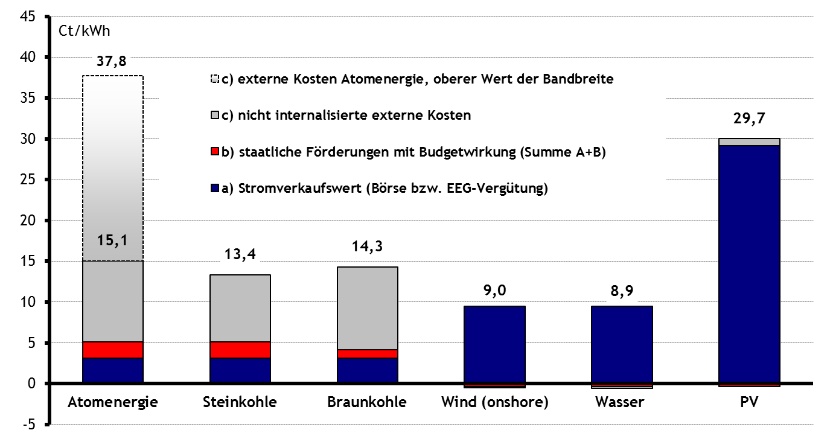
Attached once a comparison of costs with data basis of 2016 with breakdown by type of energy production.
Please always keep in mind that things like final storage and Co for nuclear energy, there are not calculated.
Especially due to the technological development, the costs for renewable energies have decreased in the meantime, while the yields are increasing.
The optimization level for fossil energy sources, on the other hand, has almost been reached.
Statistical dodge: In all documents of the federal government, the subsidies are stated comparatively low, because tax advantages, refunds and incurred follow-up costs such as renaturation or even the storage costs for final disposal are not to be recorded as subsidies.