
$BTC (+0.77%)
Power Law: Can a mathematical model predict the future price? 📈🔮
Today we're talking about the so-called Bitcoin Power Lawor in German, the power law of Bitcoin. This model attempts to explain the long-term price development of Bitcoin using mathematical principles.
But is it even possible to predict something that is based on the supply and demand of people - like the price of a good?
What is the Bitcoin Power Law model?
The Bitcoin Power Law is a mathematical model that describes how the price of Bitcoin grows over time. It is based on the power law, a concept that is used in many areas of nature and science. Simply put, it shows how one quantity (e.g. the price) grows as a power of another quantity (e.g. time).
Power laws occur primarily in nature, such as in the growth of organisms, and in networks.
Giovanni Santostasi and the Bitcoin Power Law
The astrophysicist Giovanni Santostasi was instrumental in developing and popularizing this model. He (and other physicists) have established that Bitcoin has approximately followed such a power law over the last 15 years - which is quite remarkable.
His scientific approach shifts the focus away from a financial instrument to a networkthat is similar to a living organism grows. This ties in directly with the idea of "Metcalfe's Law", which describes the value of a network in proportion to the number of participants squared. Bitcoin as a network therefore becomes exponentially more valuable with each new user - with decreasing growth.
But what exactly does this mean?
You can think of this model like a big ball of yarn. It all starts with the first user using Bitcoin and thereby giving it a certain value. The more users there are, the higher the value of Bitcoin rises. A higher price in turn attracts more miners, who invest more resources in mining. This increased activity leads to an increase in mining difficulty, which means that miners need more income per coin. At the same time, the growing hashrate (computing power of the network) increases the security of Bitcoin, which in turn attracts more users - and the cycle starts all over again.
Santostasi calls this feedback loop between price, miners and users the feedback logic. He describes it using a mathematical model based on exponential growth.
If you plot the Bitcoin chart not linearly as usual, but logarithmically (on the x & y axes), you can suddenly see that Bitcoin has been following a line with over- and under-performance so far.
-> This line (green) is the Bitcoin Power Law💪
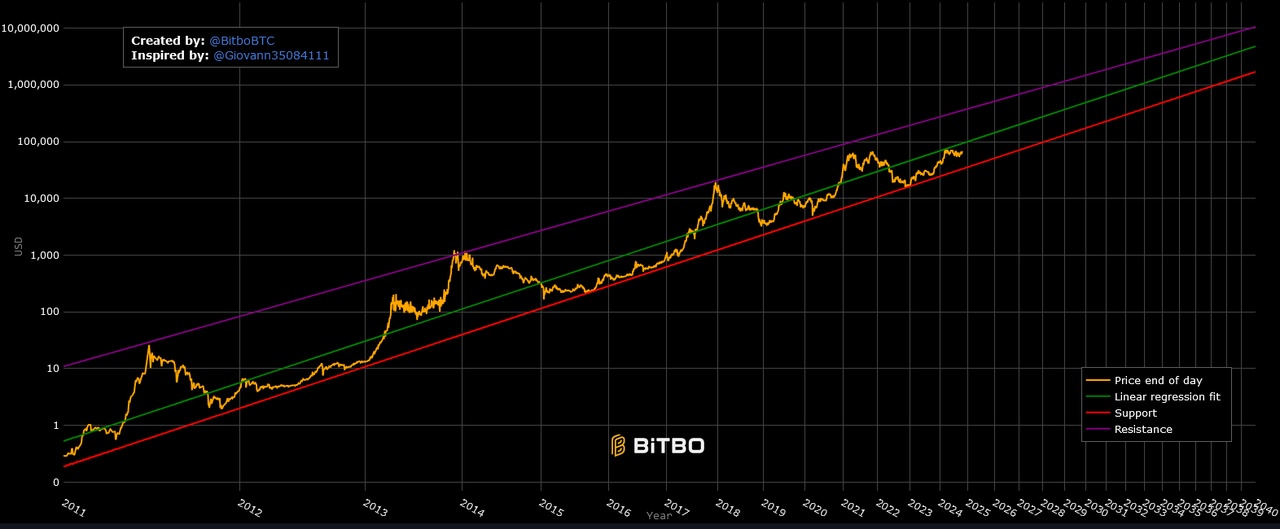
(Source: https://charts.bitbo.io/long-term-power-law/)
Does this now mean that we can predict the Bitcoin price for all time in the future?
I'm not entirely convinced yet, but at least there are already websites like https://bitcoinfairprice.com/where you can select any date in the past or future and then get the "fair value" of Bitcoin for that date based on the power law model😅
So when will we reach the $1 million mark according to this model?
The answer according to the power law is: 2033
For the next 10 years it would look like this:
2024: $68.434
2025: $99.794
2026: $142.232
2027: $198.653
2028: $272.486
2029: $367.749
2030: $489.108
2031: $641.941
2032: $832.407
2033: $1.067.513
2034: $1.355.187
Conclusion
The Bitcoin Power Law shows how Bitcoin grows exponentially through network effects and self-reinforcing processes. It is a useful tool to understand the long-term development of Bitcoin, but should definitely not be taken as absolute truth.
I always find it very difficult to make predictions for the future based on the past. After all, there are countless external factors, such as regulations, global crises and the like, which all have an influence on the price.
Nevertheless, it is interesting that this model can at least be applied to Bitcoin's recent past.
I deliberately wanted to keep this article a little shorter. If you want to find out more about the Bitcoin Power Law, I can recommend Giovanni Santostasi's blog page:
https://giovannisantostasi.medium.com/the-bitcoin-power-law-theory-962dfaf99ee9
What do you think, is there anything to the Bitcoin Power Law or is it only valid again anyway until the price does something completely different? :D
Have a nice afternoon/evening!


