Good morning everyone, :)
POST NO.2
Thanks for all the comments and interactions yesterday. I didn't think that so many people would find it interesting.
Foreword
I have now thought about how best to structure the whole thing.
The first posts will now cover the basic topics. These are interesting for everyone, whether trader or investor you can also apply these concepts to any exchange traded asset I know (Crypto, Forex, Commodities, Stocks, etc.). I myself trade and invest in all 4 and will also gradually show examples of different asset classes.
Posts will go into chart analysis but I will keep it really simple. We don't use indicators or anything here the only thing you need is the chart.
Take the time and patience to understand the whole thing I can promise you that you will invest, trade or generally move in the market environment with a hugely increased confidence afterwards.
The charting tool I use is Tradingview - free to access for everyone. I will link both Tradingview and the individual tickers of the charts in the images (with timeframes) at the end so that those who want to can view it for themselves.
As with the last post, I'll be happy to answer any questions :)
Have fun!
Introduction
We roughly touched on a few things in my last post. For those who haven't read that one yet, I would recommend this one. https://app.getquin.com/activity/HEjsMIIAQo
It was about why the market moves the way it does and I told you that it moves according to supply and demand as well as liquidity.
Structure / Orderflow / "Trend
Before I can show you where and how to recognize liquidity, I have to show you that every market and every asset always follows a certain structure. This happens through different things.
- Orderflow: Orderflow occurs when "smart money" builds up large positions. They don't do that with a 500 million$ buy/sell, but they split their order. A 500 million order would have too great an impact on the market and would cause the price to rise or fall so disproportionately that the entry price would no longer be good. Accordingly, they build up with the denomination of the order in the meantime always new liquidity.
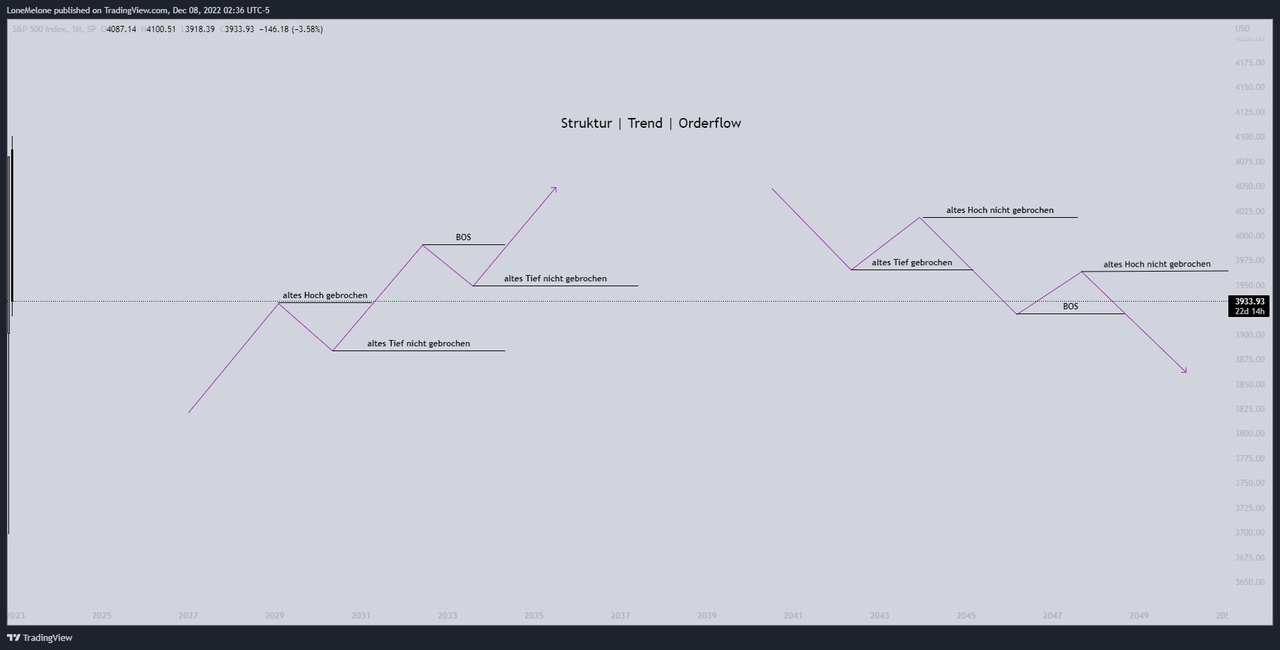
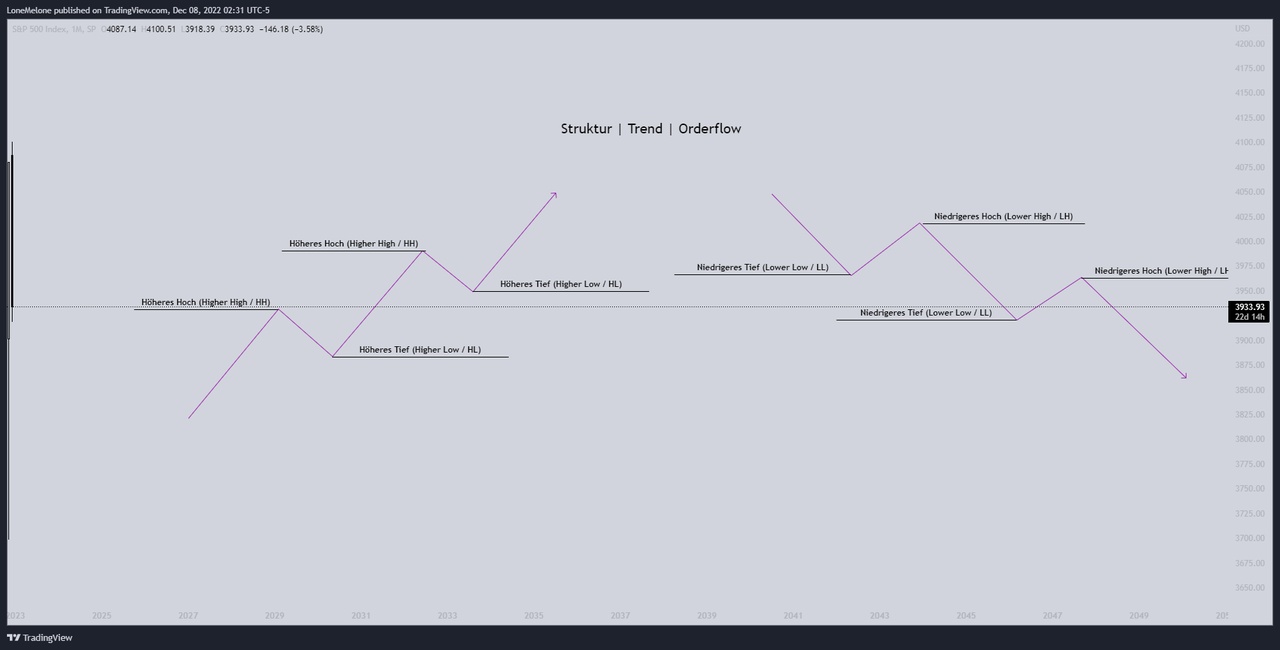
- A trend is basically just structure / order flow. "Smart money" builds up your position and uses any liquidity to make your position bigger. They do this until at some point they think the asset is overvalued. Then a trend change occurs and they do the same in the opposite direction.Many have said they trade/invest using a trend following strategy. This is definitely a correct approach only what if I tell you that there are very clear signs in the structure of a chart that allow you to recognize a trend change early. Picture No. 1. and 3 Here we see the basic structure of each chart. Left Bullish (Uptrend) We have a higher high and a higher low. This higher high must always be broken for us to advance to the next leg. The low must not be broken otherwise we have a first sign of a trend change. From the next post I will abbreviate on the charts a higher low only with "HL" and a higher high only with "HH".
- Right Bearish (Downtrend) We have a lower low and a lower high. In order for us to maintain the structure the lower low must always be broken and the high must not be broken.
- BOS in this chart stands for Break of Structure and is just a synonym for old high broken or old low broken
This structure continues until a trend change occurs.
A change in trend:
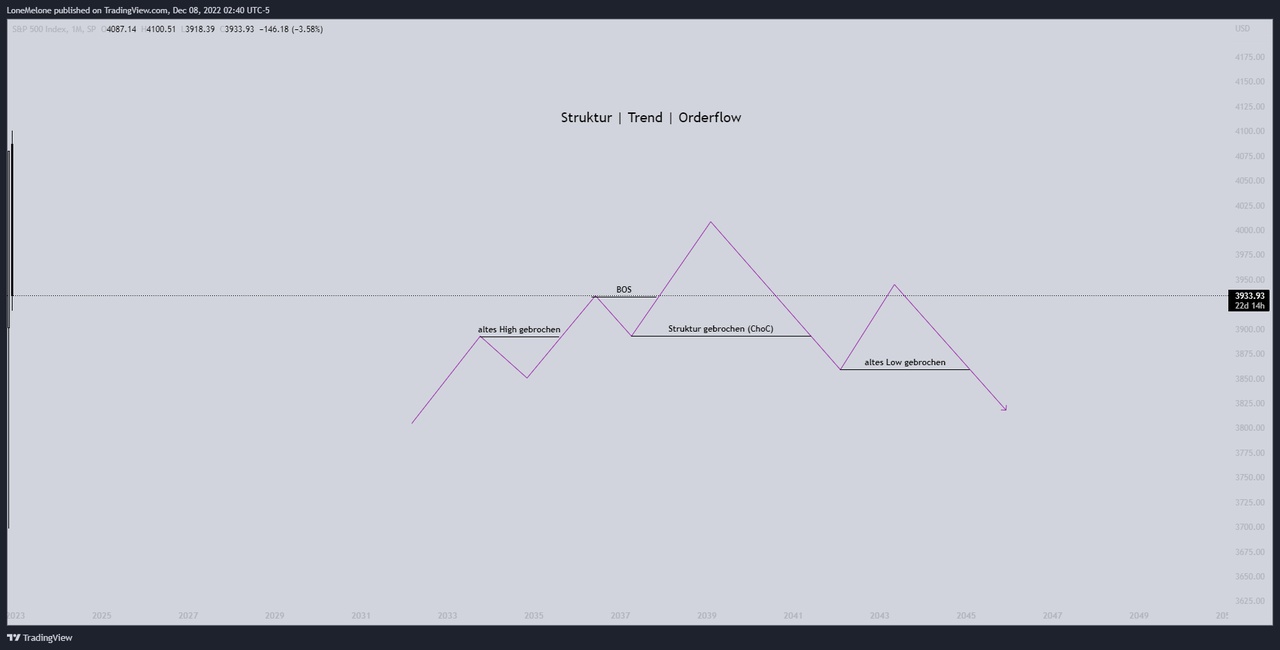
I now explain this using a Bullish structure (Uptrend) the same applies to the Bearishe structure only in reverse. Picture No. 2
- As soon as an old high is broken, we have a new low that must not be broken (as described above).
- As soon as we see a clear break, a trend change is indicated (means on a weekly time frame a weekly candle with the body must break the low).
- This is called ChoC (Change of Character) or also MSS (Market Structure Shift) I have it here on the chart with structure broken marked. I will use in the future but also only ChoC.
- A ChoC says that the character of the structure has changed - it means a trend change. We have not created a higher high as usual, but a lower low.
- From this point on we assume falling prices, so we either start to sell in the correction after our ChoC or accumulate short positions (if one trades). Or who wants to continue only Buy&Hold should now at least for the time being no longer buy, but wait until a new trend change arises. So he does not reach into the falling knife and has probably the lowest-risk strategy.
- Always remember - "Smart Money" also always needs new liquidity, so there are ALWAYS small corrections that can be used as an entry. Where there are the best entries, I will explain in later posts yet.
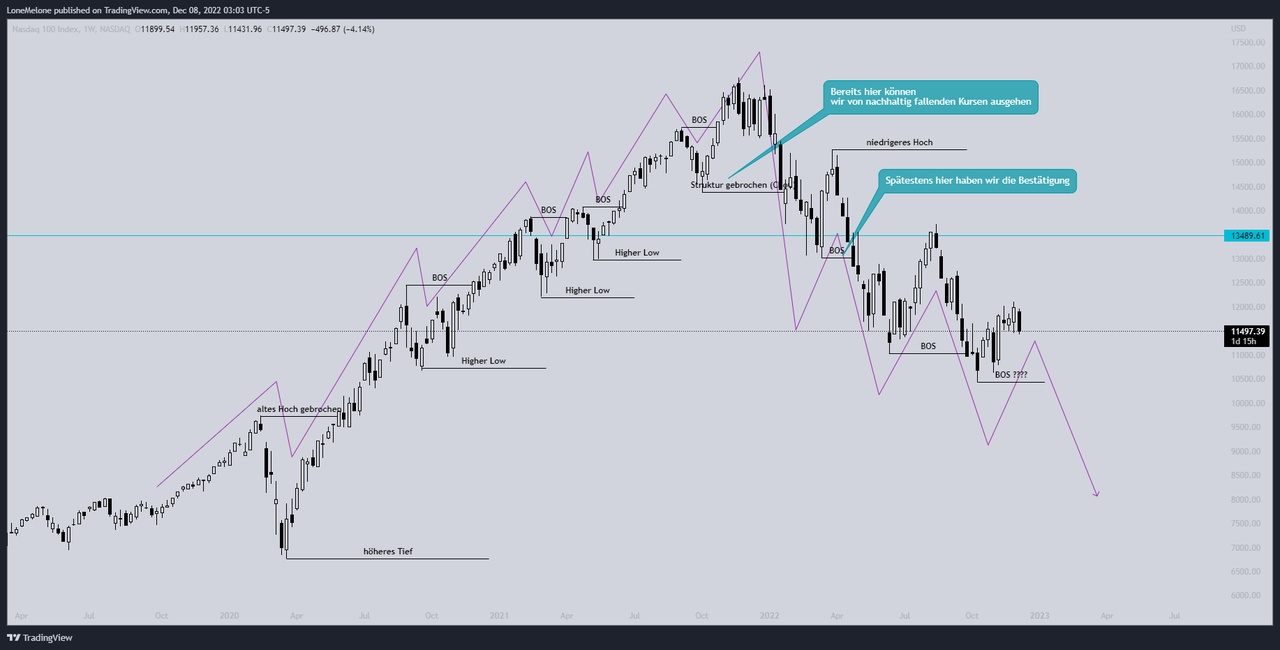
- We always trade or invest only with the active trend / structure. Accordingly, we only buy in a Bullish structure and sell only in a Bearishen structure. (At least as a beginner) As last I have you the whole again on the weekly chart of the Nasdaq 100 Picture No.3At first glance, this may look complicated. But it is not
- We are first in a Bullish Structure. We keep making higher highs and higher lows. With each high that is broken, there is a new low. The trend continues until a low is broken.
- I will boldly say that most of you reading this post did not expect such a sharp sell off in January. But I tell you that it happens with every asset and especially on every time frame.
This was the introduction to Structure / Orderflow / Trends
I decided to split this part into two posts. The next post will be even more important. I will show you why you can know in advance when the trend changes and at what point you can expect a new trend change at the latest.
Epilogue
I think that was now all relatively much at once, is certainly for many also new territory. But I can tell you that if you follow the posts and can then apply the basics in the future, -30 / -40% positions in your portfolio will be an exception even in the bear market.
If you have ideas how I can structure the whole thing better or certain sections were unclear, let me know.
Sorry for the English in between, by the way, is habit.
Does anyone still have tips on how I can embed images in the text ? Unfortunately, this does not work and also my formatting is regularly completely spanked :/ So now I hope it is still reasonably clear.
Here are the links
Ticker : NDX
Time frame : Week (W)