1) The plan
As some may already know, I am pursuing a dual momentum strategy with two ETFs from each of four asset classes (GTAA). In order not to be solely dependent on the success of this strategy, I am looking for another strategy that works largely independently and autonomously.
The perennial favorite B&H ACWI is out of the question for me, as a long-term return of 6%pa return with a risk of 60% max. drawdown is not a good risk/reward ratio in my eyes. Even the king of all indices S&P500 has (since 2000) only a performance of 7.6%pa with a max. drawdown of over -50%. In both cases, the return succession risk is so high that the safe withdrawal rate (approx. 3%pa) is too low for early financial freedom.
So I am looking for a strategy that offers: 1. a continuous double-digit return (>10%pa); 2. a psychologically easily bearable risk (<20% max. drawdown); 3. a cheap and convenient implementation similar to B&H ACWI (<2 transactions per year) and 4. a simple structure (1-2 ETFs). In short: I want a simple model that is systematically invested in bull markets and avoids bear markets.
In this post, I'll not only show you a brand new and largely unknown strategy that does just that, but also the thought process behind it. So you not only get the fish, but also the fishing rod. Interested? Then buckle up!
2) The classic: 200-day strategy
The classic approach to avoiding bear markets and participating in bull markets is trend following. Of the trend-following strategies, the 200-day strategy is probably the best known:
Rule: Buy an S&P500 ETF if the S&P500 is trading above the 200-day moving average at the end of the month. Otherwise, hold cash.
Result (since 2000): Return 8.1%pa, risk -22%maxDD. https://www.portfoliovisualizer.com/tactical-asset-allocation-model?s=y&sl=FYqXW8M7rFydJjq30MbKy (the following backtests are in USD and go back to the year 2000, if you want to see the whole thing, just create a test account)
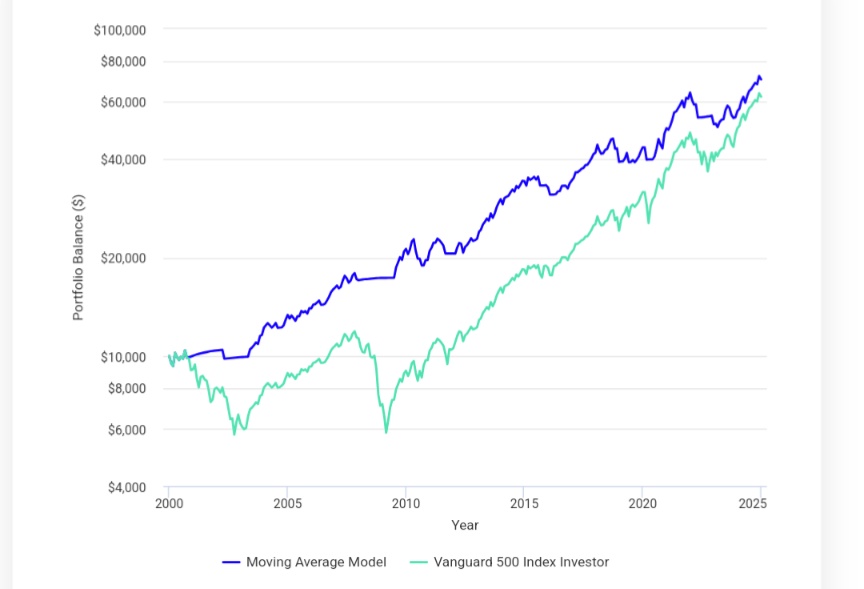
Evaluation: The 200-day strategy meets the requirements for risk and simplicity, but not for return. Why? With trend-following strategies, you don't catch the highs or the lows, but only the "middle" trend phases. You avoid the crashes and are present in the boom phases, but miss the major trend reversals and underperform in saw markets. The result is less volatility, but no higher returns. This can be tackled with the leveraged 200-day strategy.
Rule: Buy a 2x leveraged S&P500 ETF if the S&P500 is trading above the 200-day moving average at the end of the month. Otherwise, hold cash.
Result (since 2000): Return 12.2%pa, risk -42%maxDD. https://www.portfoliovisualizer.com/tactical-asset-allocation-model?s=y&sl=1GXyWqmgMP0qn1Mxnq8B7B (I replicated the 2xS&P500 ETF synthetically by leveraging the index 2x with 3% refinancing costs - this roughly corresponds to the ETF)
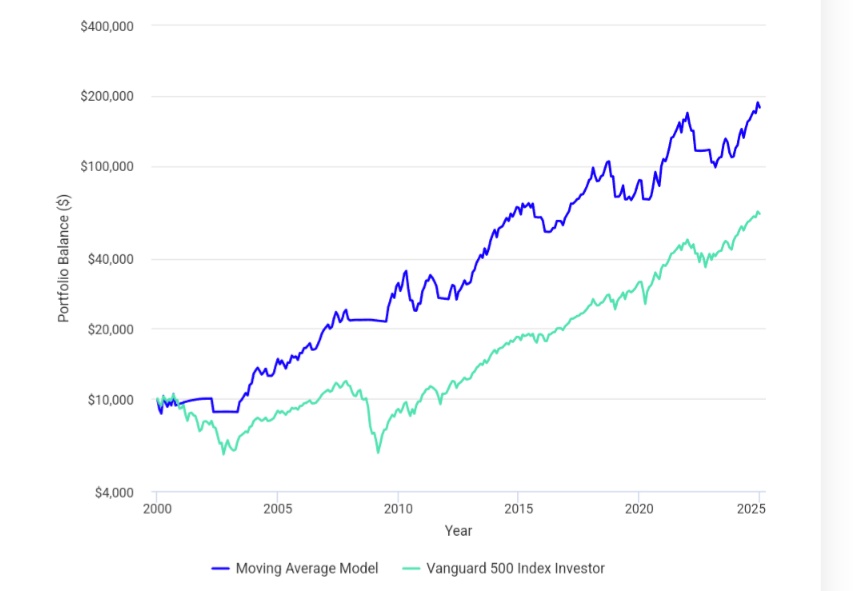
Evaluation: The return now meets the requirements, but the risk no longer does. Due to the refinancing costs and the leverage decay, the risk increases even more than the return.
Conclusion: The two simple strategies illustrate the difficulty of finding a simple strategy that both increases the return and reduces the risk. So let's go one step further. Attention, now it's getting economic!
3) The interest rate indicator strategy
The starting point is the following simple basic insight, which probably everyone knows: stock markets are primarily driven by liquidity. If there is an abundance of money, all shares are bought; if there is a shortage, most shares fall. When is liquidity injected into the market? That's right! When interest rates fall. A simple interest-based trading strategy can perhaps be derived from this:
Rule: buy the S&P500 ETF when a 7-10y US government bond ETF is trading above the 200-day moving average at month-end (i.e. interest rates are falling). Otherwise hold cash.
Result (since 2000): Yield 6.5%pa, risk -47%maxDD. https://www.portfoliovisualizer.com/tactical-asset-allocation-model?s=y&sl=5PYIS7ZMzBy3AREti5VHyG
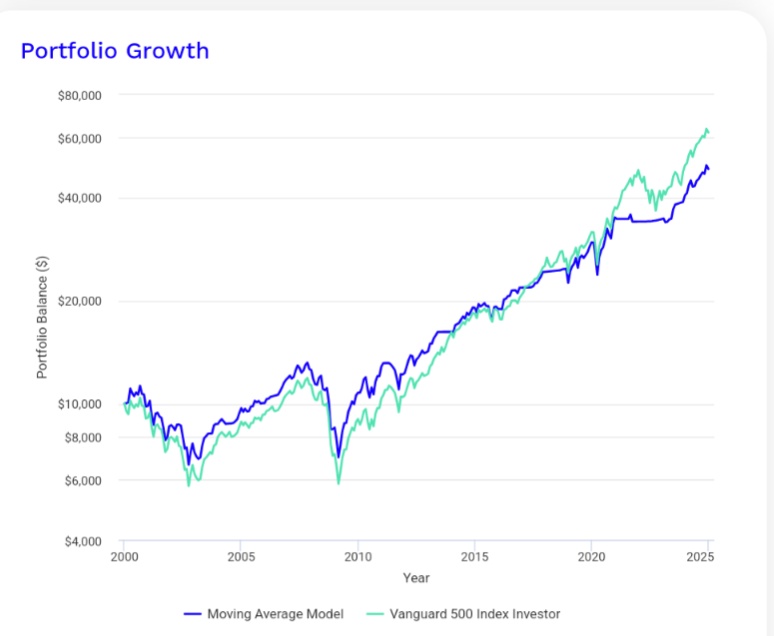
Evaluation: The simple model brings no improvement compared to B&H S&P500 (7.6%pa, -51%mDD). Why? Quite simply, when interest rates fall, it is never for no reason, usually because the economy needs it and then the stock markets usually fall too or they have already fallen or vice versa. In any case, falling interest rates are not necessarily positive for equity markets.
This insight can be used to construct a combined trading strategy that only invests when interest rates are falling and equity markets are rising:
Rule: Buy S&P500 ETF if at the end of the month the US 7-10y bond ETF AND the S&P500 are trading above their 200-day moving averages. Otherwise hold cash.
Result: return 8.4%pa, risk -16.6%maxDD. https://www.portfoliovisualizer.com/tactical-asset-allocation-model?s=y&sl=18bID68QT1iNCfN3HxEV4A (since PV does not allow the exact backtest of the rule, I created a synthetic 200-day average with the 5 lookback periods - the results should hardly differ).
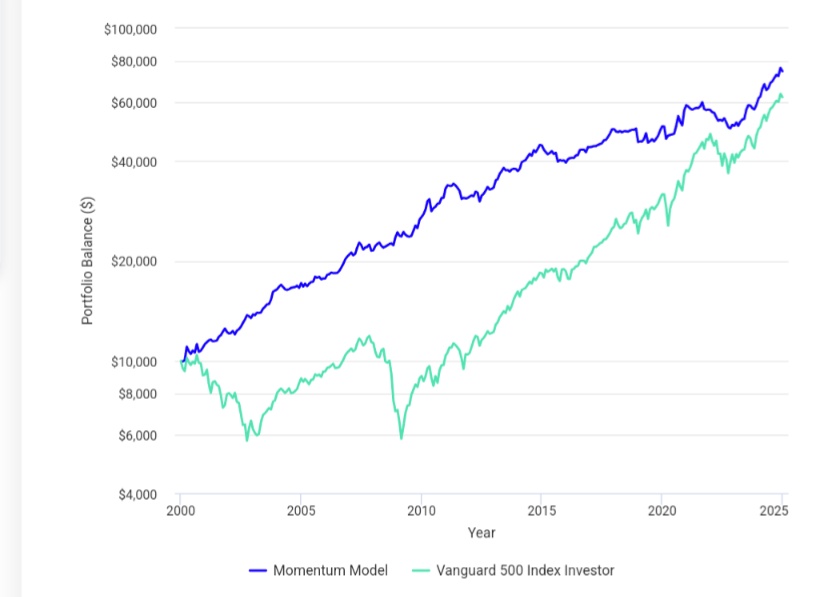
Conclusion: The combination of 200-day and interest rate indicator significantly reduces the risk again, but the return remains below the requirements. Interest rates alone are therefore not a sufficient indicator for the strategy we are looking for. The third and final step follows. Attention: now it gets a little more complicated - so keep concentrating!
4) The TIPS indicator strategy
The starting point is again a simple, basic economic insight: Central banks have a political mandate to keep inflation low. They raise interest rates when the economy is booming and (therefore) inflation is rising, and they lower interest rates when the economy is in crisis and (therefore) inflation is falling. If inflation is taken into account for interest rates, the following picture emerges: central banks withdraw liquidity from the capital market when interest rates rise more sharply or fall more slowly than inflation ("hawkish"; "ahead of the curve"). Conversely, they inject liquidity into the market when interest rates rise more slowly or fall faster than inflation ("dovish", "behind the curve"). The decisive factor for assessing liquidity flows is therefore the change in real interest rates (= key interest rates minus inflation). In short: if real interest rates fall, money flows into the markets; if they rise, money flows out.
How cool would it be if you could track changes in real interest rates at a glance and in real time? You can, with Treasury Inflation Protected Securities (TIPS). This special type of US government bond does not pay a fixed interest rate, but in simple terms a fixed difference to the inflation rate. For example, if this difference is 1% and the inflation rate is 3%, then the bond pays 4%. TIPS therefore show the real interest rates live. As with normal bonds, TIPS rise when real interest rates fall and vice versa.
These insights can now be translated into a trading strategy by replacing the 7-10y US government bond ETF with a US TIPS ETF:
Rule: Buy S&P500 ETF if at month end the US TIPS ETF AND the S&P500 are trading above their 200-day moving averages. Otherwise, hold cash.
Result: Return: 9.8%pa, risk: -9.2% maxDD. https://www.portfoliovisualizer.com/tactical-asset-allocation-model?s=y&sl=56b7uZNB4k0v58mav0puPB
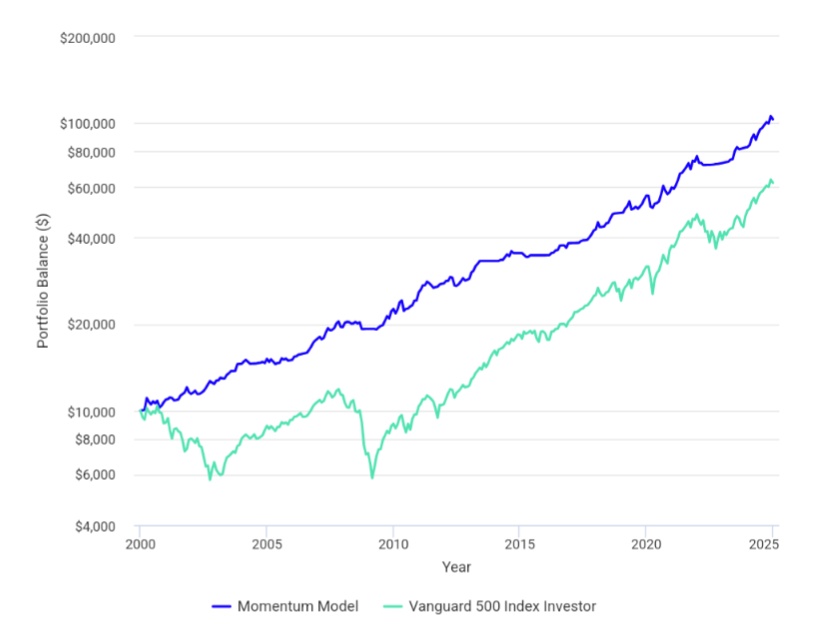
Evaluation: Voilá! The TIPS strategy shows a significantly reduced risk with the same return. This clears the way for leverage.
Rule: Buy a 2x leveraged S&P500 ETF if the US TIPS ETF AND the S&P500 are trading above their 200-day moving averages at the end of the month. Otherwise hold cash.
Result: Return 16.2%pa, risk -18.9% maxDD. https://www.portfoliovisualizer.com/tactical-asset-allocation-model?s=y&sl=5ihDYER8Ic5YwBzYQblrYa
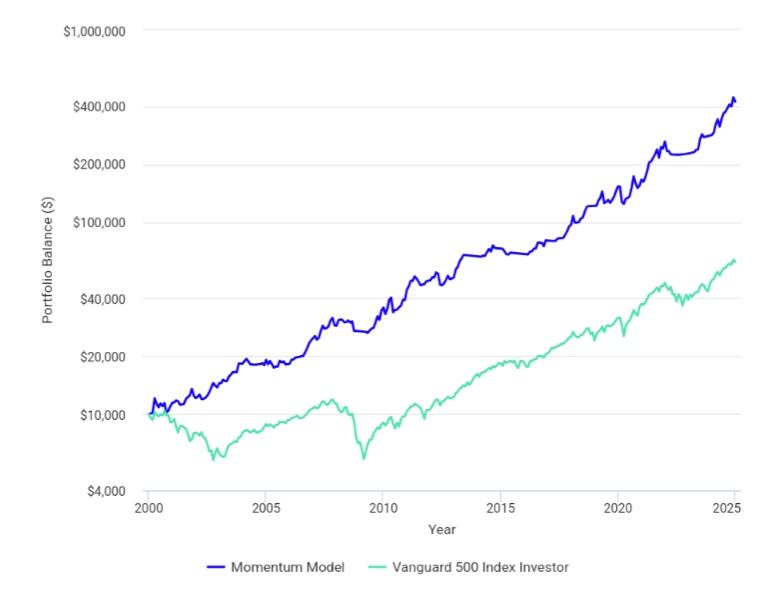
Evaluation: We have thus found a strategy that meets all the requirements: it is logical (real interest rate differential as liquidity indicator combined with the best of all factors: momentum), performant (16%pa), low-risk (-18.9%mDD) and simple (one ETF; 1.6 transactions pa). I have called them 2xSPYTIPS, not very creatively, but aptly.
5) Extensions, modifications, taxes, applications
I have just shown you the simplest version of 2xSPYTIPS. Of course, the model parameters can be further optimized. For example, you can change the average (from 200 days to 150 days) or use money market ETFs, short-dated government bonds or even gold instead of cash as an out-of-market asset. Try it out yourself for portfolio performance! However, only use assets that are highly likely to be followed by market participants in the future, such as the 200-day moving average. I myself will start a modified model in my own portfolio in 2025, which has slightly better performance data and is optimized to minimize transaction costs.
Some of you foxes are probably thinking to yourselves now: What works with the S&P500 should surely also work even better with other, better performing indices. Unfortunately, this is not the case: 2xNasdaq100: return 17.8%, risk -55% maxDD; US small caps: return 7.6%, risk -53% maxDD. Why? This is probably because the US large caps in particular depend on liquidity. Technology and small-cap stocks obviously have other dominant influencing factors. Therefore, BTC does not work so well either, even though I have found TIPS-based strategies that deliver even higher returns and avoid the deep drawdowns of BTC.
There is still the vexed question of taxation: the reallocations normally result in capital gains tax, which reduces the return. 26% CIT less 30% partial exemption = 18% CIT. 16.2%pa - 18% KES = 13.3%pa. Not pretty, but still worlds better than the 6%pa with B&H ACWI. I know of only one way to get around these costs without too much trouble: in a tax sheltered wrapper that allows leveraged ETFs to be traded. As far as I know, this is via Wikifolio (0.95%pa costs + 5% profit commission) or via "Mylife Invest" (0.5%pa costs + 0.2% per transaction). In both variants you would end up with approx. 15%pa after costs. Unfortunately, both variants have a catch: a "2xSPYTIPS Wikifolio" does not (yet) exist and "Mylife Invest" is an insurance policy (for many here it's the devil's bargain, but for this particular strategy it may be just the right thing - I'm also planning to go this route for the next few years because of the tax benefits in the payout phase).
6) ETF recommendations
Index: Xtrackers S&P 500 2x Leveraged Daily Swap UCITS ETF, LU0411078552
Cash: Xtrackers II EUR Overnight Rate Swap UCITS ETF 1C, LU0290358497
Indicator: iShares USD TIPS UCITS ETF EUR Hedged (Acc), IE00BDZVH966
7) Literature
The strategy is inspired by the article: Keller/ Keuning: Dual and Canary Momentum with Rising Yields/Inflation: Hybrid Asset Allocation (HAA), 2023. https://papers.ssrn.com/sol3/papers.cfm?abstract_id=4346906&download=yes
Outside of that, you won't find much on the web about this strategy.
What do you think of 2xSPYTIPS? Let us know in the comments!
Your Epi
Addendum: There are many great suggestions for improving the strategy. Very detailed and reflective is the one from @SemiGrowth in his contribution: https://getqu.in/THTI9I/ Thanks for that!


