
Smart Beta ETF
Part 2 - Deep f***ing Value
Disclaimer: No investment advice or recommendation, this article is for information purposes only. Before you decide on an ETF, take a closer look at it in terms of positions, sampling, regions, etc. I can't describe everything here as it would go beyond the scope of this article
Part 1 (Definition, Categories & Z-Score and Quality Factor): https://getqu.in/RCSY4a/
💡 Value ETF
Focus on shares that are (undervalued) as attractive from a fundamental perspective. Valuation benchmarks here can be, for example, cash flow in relation to book value or P/E ratio, price to book value, etc. In contrast to momentum or growth ETFs, for example, they have a more fundamentally supported valuation. In theory, there should be a "value premium" for these shares, which is based on the study by Fama and French, according to which differences in returns between shares can also be explained by size and value factors in addition to the classic beta factor.
👉 Interest rate dependency
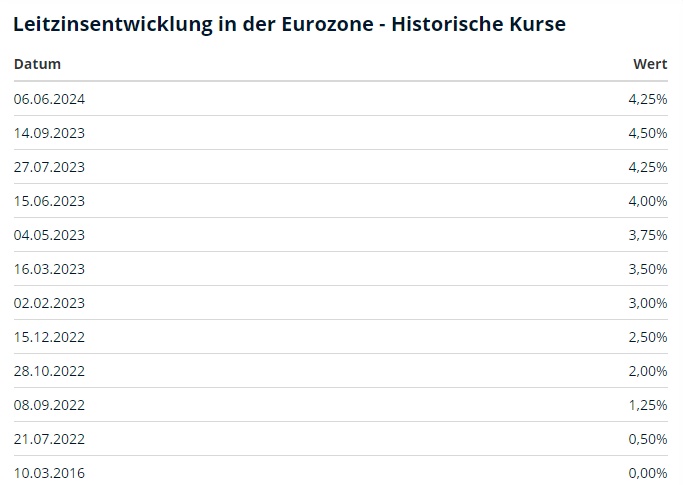
This also means that value stocks should tend to outperform growth stocks in times of sharp interest rate increases (or the expectation of such increases).
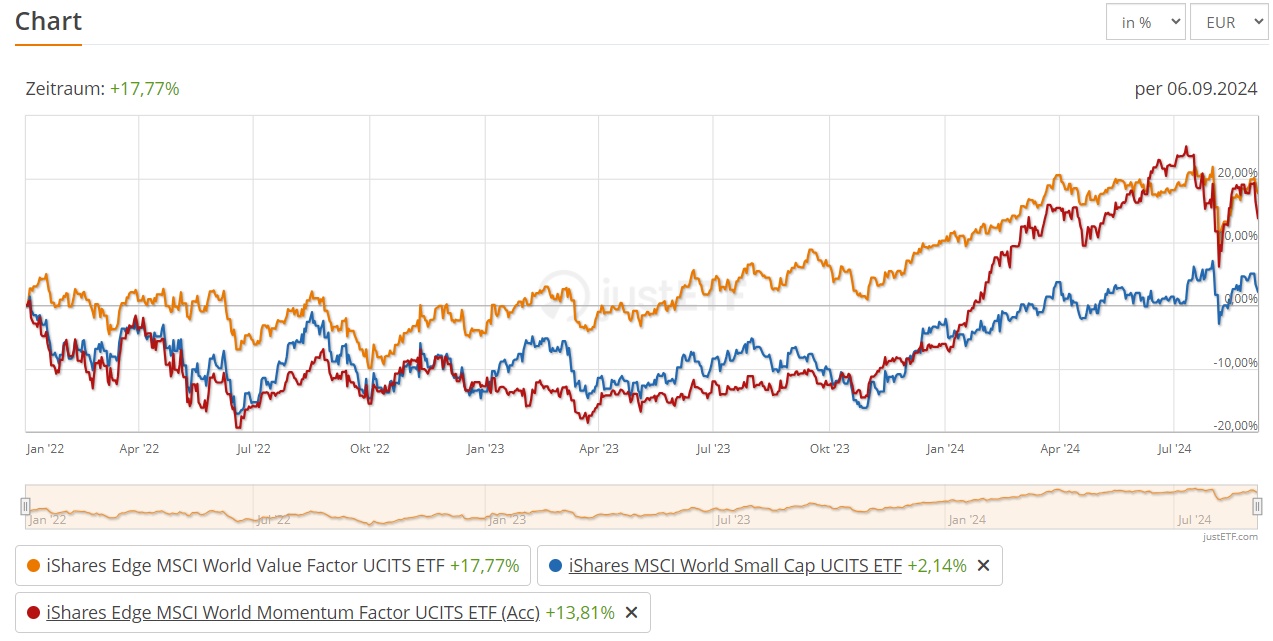
This can also be seen in a direct comparison of $IWVL, $WSML, $IS3R. In the period 2022-2023, the $IWVL outperformed the other two by 13% and 16% respectively. However, it can also be seen that in anticipation of an interest rate cut, Growth & Momentum strongly outperform the Value ETF (Fig. 1).
👉 Correlation/beta
The correlation of value ETFs to their "parent indices", i.e. World Value to Value, for example, is around 0.9. This means that, in simplified terms, the value ETF is only 90% as volatile as its parent index, i.e. it is less volatile. Weak market phases can therefore be easily mitigated
👉ETFs:
👉Z-Score MSCI Value ETF
There are 4 larger ETFs that are the same in terms of methodology but focus on different regions (TD = tracking difference):
- $IWVL (+0.3%) (World | TER 0.30 % | TD -0.02 % | 3.5 bn Investv. | 3Y Underperf. vs. World - 2,1 %.)
- $IUVF (+0.63%) (USA | TER 0.20 % | TD -0.24 % | 1.7 bn | 3Y Underperf. vs. S&P 500 - 19,5 %.)
- $XDEV (+0.4%) (World | TER 0.25 % | TD -0.09 % | 1.7 bn | 3Y Underperf. vs. world - 1,7 %.)
- $IEFV (-0.38%) (Europe | TER 0.25 % | TD -0.20 % | 1.4 bn | 3Y Outperf. vs. Eurostoxx 600 -+6,4 %).
💡 Index methodology:
- The ETFs are based on respective "parent indices", e.g. the MSCI World.
- In the first step, the variables are named for the value ETF:
- Expected earnings per share (price-earnings ratio)
- Price-to-book value (price-to-book value ratio)
- Equity value / cash flow from operations (unlevered equity / operating cash inflow)
- For each share, the Z-value (see first article) is determined for the individual key figures
- Extreme values are then eliminated
- The Z-values are then added together for each share
- The shares with the highest total Z-scores are included in the ETF
- Rebalancing takes place every six months (May & November)
👉 Ossiam Shiller Barclays CAPE
$216361 (-0.08%) (US | TER 0.65 % | TD 0.66 % | 2.5 bn | 3Y Underperf. vs. S&P 500 -3,35 %)- $CAPE (-1.04%) (Europe | TER 0.65 % | TD 0.64 | 0.2 bn | 3Y Outperf. vs. Eurostoxx 600 1,2 %)
💡 Index methodology:
- Based on the Cyclically Adjusted PE Ratio (CAPE Ratio) developed by Shiller
- The equity market, e.g. the US market, is divided into sectors (in this case 11) and the respective sector price earnings are determined. The inflation-adjusted (10-year) sector profits are used for this purpose
- A CAPE ratio is then calculated monthly for each sector and this is set in relation to the 20-year average for the sector.
- The 5 sectors with the lowest relative CAPE ratio are selected, as these are considered undervalued
- From these 5, the sector with the weakest 12-month price momentum is filtered out to avoid "value traps"
- The remaining 4 sectors are then weighted at 25%.
Conclusion Value:
The value premium was particularly evident in the 80-90s and after the dotcom bubble burst in the 2000s, but in the years that followed, growth stocks performed significantly better, so the value factor was more of a drag on returns. It is also questionable whether the value premium has come under pressure in the wake of changing business models. Instead of P/E ratios and P/B ratios, SAAS companies have their own KPIs such as Customer Acquisition Cost (CAC) or Annual Recurring Revenue (ARR), Daily Active Users (DAU) and many more.
However, if one follows the reversion to the mean approach that values tend to revert to the long-term mean, excessive differences in returns between value and growth stocks could be used to speculate on a convergence of these, in this case a resurgence of the value premium. The selection of these ETFs is therefore a bet that the value factor will prevail over growth companies in the future.
It is a pity that there is no value emerging markets ETF that I know of, as I believe it would be particularly important to pay special attention to the stability of equities here. There is a tendency for the European indices to outperform the benchmark index, which could be due to the fact that Europe is more value-oriented and does not have any large growth companies like the USA, for example. Anyone interested in the Shiller-Barclays-CAPE ETF (an exciting approach in my view) should in any case be aware of the high tracking differences.


