𝙄𝙣𝙫𝙚𝙨𝙩𝙢𝙚𝙣𝙩𝙩𝙝𝙚𝙨𝙚: "𝙁𝙧𝙚𝙞𝙝𝙚𝙞𝙩𝙨𝙚𝙣𝙚𝙧𝙜𝙞𝙚𝙣" 𝙖𝙪𝙛 𝙙𝙚𝙢 𝙑𝙤𝙧𝙢𝙖𝙧𝙨𝙘𝙝. 𝙒𝙖𝙘𝙝𝙨𝙩𝙪𝙢 𝙙𝙪𝙧𝙘𝙝 𝙐𝙣𝙖𝙗𝙝ä𝙣𝙜𝙞𝙜𝙠𝙚𝙞𝙩 𝙫𝙤𝙣 𝙂𝙖𝙨 𝙪𝙣𝙙 Ö𝙡!
--- 7c Solarparken --- Energiekontor --- Solaredge ---
For the next stock presentation, I am deviating somewhat from my previous way of analyzing stocks. Since all three stocks have been requested by the community and belong to the "Green Energy" sector, especially PV and wind farms, I would like to focus on the fundamental quality and compare the stocks in this respect. If you want to get something in the green energy sector into your portfolio, there is certainly no way around comparing the stocks. Please give me your feedback on this type of analysis and vote for the stock that appeals to you the most :)
𝗜𝗻𝗵𝗮𝗹𝘁𝘀𝘃𝗲𝗿𝘇𝗲𝗶𝗰𝗵𝗻𝗶𝘀:
I. Short stock presentation
II. key figures
III. relative company valuation
IV. Intrinsic company valuation
V. Conclusion
In chapters II to IV I will create rankings. There are points per category, in the form of "+".
+++ = best rating
+ = worst rating
In Chapter V (Conclusion), I will summarize the ratings and select a winner.
𝗜. 𝗞𝘂𝗿𝘇𝗲 𝗔𝗸𝘁𝗶𝗲𝗻𝘃𝗼𝗿𝘀𝘁𝗲𝗹𝗹𝘂𝗻𝗴
-7c Solarparken:
Solar power plant operator based in Bayreuth, focus on the German solar market and expansion of the Belgian market as a second pillar (according to AR 2021, intensive expansion will begin there)[7].
Revenue: Revenue is mainly generated from the operation, maintenance and management services of its own IPP portfolio (solar parks), as well as its own solar plants and PV estate (leasing and development of its own land). According to the 2021 annual report, 7C Solarparken operates more than 180 solar parks with a total capacity of 333 Mwp. The Group's wind energy portfolio consists of two operational wind power plants acquired in 2019. Both plants are located in a windy region in Rhineland-Palatinate.
Sales segments:
-Electricity sales (97.6% of total sales)
-Revenue from services
-Other
-Energy Kontor:
Planning, construction and operational management of wind farms in Germany and abroad (mainly EU). The company is based in Bremen. Business area was expanded to include solar energy in 2010[6] Energiekontor has 17 locations worldwide (according to AR 2021).
DE: 30 wind and solar parks; Great Britain: 3 wind parks; Portugal: 4 wind parks
Sales segments:
-Electricity generation (stable, growing revenue, dependent on electricity price)
-Operational management (stable turnover for commercial and technical operational management of plants)
-Project planning (volatile but growth driver, as revenue is only generated when turbines are sold - however, 50% of the turbines are retained and used in the electricity generation segment. Project pipeline but growing)
Shareholder structure: Energiekontor advertises in its annual reports with a shareholder structure in which the founders own 50.35% of the shares directly (free float at 36.18%). -->Positive!
-Solaredge:
Leading global provider of smart energy technology, in particular PV inverters, energy storage systems and EV chargers. Headquarters are located in Israel. Compared to Energiekontor and 7c Solarparken, increasingly active in the e-mobility sector. It could be said that Solaredge offers solutions that make PV systems built by 7c Solarparken or Energiekontor more efficient. Their technology is designed to make PV systems function more efficiently, even in dirt, snow or shade. Around 50% of sales are still generated in the USA (Europe approx. 25%). [5]
-Comparison:
-->The business areas are very similar. Nevertheless, the companies have different strategies in some cases. Solaredge, for example, has EV chargers in its portfolio. Energiekontor also retains only around 50% of the plants built in its fixed assets for electricity supply, while the rest is sold directly at a profit. There are therefore overlaps (especially in the PV business), as well as different orientations. All are dependent to a certain extent on the electricity price or wind speeds for the wind farms. Depending on electricity production and price, sales can vary. A good example is an interim statement from Solarparken. The following was reported [13]:
"Revenue for the first three months of 2022 amounted to EUR 14.1 million, which corresponds to a brilliant increase of 70% compared to the same period of the previous year (EUR 8.3 million). The increase was entirely attributable to electricity sales, which rose by 73% and was based on the following three factors: (I) portfolio growth contributed EUR 2.1 million to the increase in revenue, while (II) improved weather conditions contributed EUR 1.6 million. (III) Finally, electricity prices had an impact of EUR 2.2 million on electricity sales."
𝗜𝗜. 𝗞𝗲𝗻𝗻𝘇𝗮𝗵𝗹𝗲𝗻
Anomalies in the balance sheet, income statement and cash flow statement (sorted by category):
-Net margin:
1. Energiekontor: 23.1% (no R&D and therefore better margin than Solaredge) +++
2. 7c Solarparken: 18.8% (no R&D and therefore better margin than Solaredge) ++
3. Solaredge: 8.6% +
-Gross margin:
1. 7c Solarparken: 92.68% (hardly any intensive margin business available) +++
2. Energiekontor: 70.73% ++
3. Solaredge: 32.04% (R&D 11% of sales) +
-Anomalies in the income statement with an impact on the margin:
7c Solarparken: Higher depreciation and impairments at 7c Solarparken, resulting in 2nd place net margin and 1st place gross margin. According to AR 2021 came out:
"The Group has come to the conclusion during the review of goodwill with regard to the feasibility of the project pipeline that there are no solar projects in the Amatec business operation that can probably be implemented in the next 3 years. This business operation was therefore fully impaired in the financial year (EUR 104 thousand)."
-->This reduces the net margin at 7c Solarparken on a one-off basis!
Solaredge: Higher expenses in research and development and marketing. Solaredge is said to have a technological lead over the competition, which is to be maintained through research and development (R&D). -->R&D = 11.18% of total sales
Ratio of current liabilities to current assets (should be <1 sein):
1. Solaredge: 0,3 +++
2. 7c Solarparken: 0,49 ++ **
-->7c Solarparken has predominantly non-current liabilities (positive). However, these are quite high (53.49% of total assets), which means that debt is higher than 4x EBIT (negative)
3. Energiekontor: 0.6 +
-->Energiekontor has predominantly long-term debt (positive). However, these are quite high (53.18% of total assets), which means that debt is higher than 4x EBIT (negative).
**7c Solarparken declares in accordance with the AR 2021 that the company's solar parks and wind farms are generally financed with a ratio of 25% equity and 75% debt.
-Goodwill:
Energiekontor: n/a
Solaredge: not relevant (4.5% of total assets)
7c Solarparken: not relevant
-->No valuation, as goodwill plays no role for any of them.
-Ratio of interest expense to EBIT (important key figure due to high debt!):
1. Solaredge: 9.6% +++
2. Energiekontor: 27.28% ++
3. 7c Solarparken: 38.9% +
-->7c Solarparken in particular worsens the net margin due to high interest charges, which it can cushion with a generally good margin (see above).
-Share buybacks:
1. Energiekontor: Yes! +++
2. Solaredge: Yes, but very low and irregular (last time March 2022) ++
3. 7c Solarparken: No! +
-Piotroski F-Score [9] [11] [12]:
1. 7c Solarparken: 7/9 +++
2. Energiekontor: 6/9 ++
3. Solaredge: 6/9 ++
-Traderfox quality and growth check [9] [11] [12]:
1st Solaredge: 14/15 (quality); 12/15 (growth) +++
2. Energiekontor: 9/15 (quality); 7/15 (growth) ++
3. 7c Solarparken: 8/15 (quality); 7/15 (growth) +
-Rule of 40 (>40 = positive):
Revenue growth + EBITDA margin (alternatively FCF margin)
1. 7c Solarparken: 10% + 86.5% = 96.5% +++
2. Solaredge: 25% + 21.5% = 46.5% ++
3. Energiekontor: 15% + 30.6% = 45.6% +
𝗜𝗜𝗜. 𝗥𝗲𝗹𝗮𝘁𝗶𝘃𝗲 𝗨𝗻𝘁𝗲𝗿𝗻𝗲𝗵𝗺𝗲𝗻𝘀𝗯𝗲𝘄𝗲𝗿𝘁𝘂𝗻𝗴
Market Averages Green and Renewable Energy [1]:
KGV: 36.54 (EU)
PEG: 0.90 (EU) -->40.4% growth! [1]
KGV: 69.30 (USA)
PEG: 4.78 (USA) -->14.49% growth! [1]
Market Average Europe in general [8]:
Euro Stoxx 50 P/E ratio as of 14.05.2022: 14.34
7c Solarparken [2]:
KGV (2022): 25.2
KGV (2023): 28.0
KGV (2024): 38.1
PEG 2022: 2.52 (growth assumptions according to Chapter IV - intrinsic valuation)
Median P/E ratio (historical): 23,48 [14]
Energiekontor [3]:
KGV (2022): 31.0
P/E RATIO (2023): 27.3
KGV (2024): 21.9
PEG 2022: 1.55 (growth assumptions according to Chapter IV - intrinsic valuation)
Solaredge [4]:
KGV (2022): 65.9
KGV (2023): 39.6
KGV (2024): 31.8
PEG 2022: 2.64 (growth assumptions according to Chapter IV - intrinsic valuation)
Median P/E ratio (historical): 49,06 [15]
Placement relative valuation:
1. Energiekontor +++
2.. 7c Solarparken ++
3. solaredge +
𝗜𝗩. 𝗜𝗻𝘁𝗿𝗶𝗻𝘀𝗶𝘀𝗰𝗵𝗲 𝗨𝗻𝘁𝗲𝗿𝗻𝗲𝗵𝗺𝗲𝗻𝘀𝗯𝗲𝘄𝗲𝗿𝘁𝘂𝗻𝗴
General market data on growth and WACC:
-Historical Green Energy growth rates over the last 5 years [1]:
Profit (EU): 29.54%
Turnover (EU): 21.24%
Profit (USA): -6.45%
Turnover (USA): -24.64%
-Expected growth rates Green Energy [1]:
EPS (EU): 40.40% -->next 5 years
Sales (EU): 54.11% -->next 2 years
EPS (USA): 14.50% -->next 5 years
Turnover (USA): 22.70% -->next 2 years
-Determination of WACC
-WACC Industrial production [10]
6,2%-8,1%
WACC Green & Renewable Energy - self-determined
6,5%
-->Conservative assumption at >7%
1) Energiekontor
-Determination of growth rate:
Growth assumptions net result future [3]:
Growth 2022 to 2023: 13.1%; growth 2023 to 2024: 24.78%
Historical EBIT growth (10 yrs): 10.95% [9]
According to the 2021 Annual Report, planning EBIT to € 55-60 million by 2023.
Economic growth according to Annual Report 2021 across all countries (DE, GB, Port, FR, USA): 5.48%
-->Growth rate: 15-20% (based on company level and industry).
Classification according to Peter Lynch: Medium growth - fast grower
The AR 2020 also assumes a growth path of 15-20%, which once again confirms my assumption. Due to the good project pipeline, which means that many plants can be completed (and sold), this is quite realistic in my opinion.
-->DCF calculation results in a fair price in the range of € 85-90
Current share price: 89.5€ (04.06.2022)
2) 7c Solarparken
-Determination of growth rate:
Growth assumptions net result future [2]:
Growth 2022 to 2023: -22%; growth 2023 to 2024: 5.66%
Historical EBIT growth (10 yrs): 12.34% [11]
EBITDA forecast according to AR 2021 for 2022: approx. 3%
Growth rate for 7c Solarparken: 5-10% (based on company level and sector)
Classification according to Peter Lynch: Medium growth (Stalwart)
-->DCF calculation due to high debt in the penny stock area! -->DCF is hardly applicable/gives no valid results. Not applicable!
3) Solaredge
-Determination of growth rate:
Historical EBIT growth (10 yrs): 1n/a, as positive EBIT only from 2015 [12]
EBIT growth (2 yrs): 32.4% in 2021; 10.16% in 2020
Growth assumptions net result future [4]:
Growth 2022 to 2023: 69%; Growth 2023 to 2024: 23%
Growth rate for Solaredge: 20-25%
Classification according to Peter Lynch: Fast Grower
-->DCF calculation not possible! FCF was negative for the last 2 years! No application! Alternatives do not provide valid values. Valuation is generally too high.
Placement intrinsic valuation:
1. Energiekontor +++
2. 7c Solarparken + (negative - high debt)
3. Solaredge + (negative - negative FCF)
𝗩. 𝗙𝗮𝘇𝗶𝘁
Total ratings (+):
1. Energiekontor : 22
2nd Solaregde: 19
2. 7c Solarparken: 19
🚀🚀Winner ENERGIEKONTOR!!!! 🚀🚀
Closing words:
I find all 3 companies very exciting and well positioned. Energiekontor still seems to me to be the most favorably valued for an entry. However, the final result is very tight. In addition, my analysis is not conclusive and qualitative factors such as management and business model are only very brief.
If you like this type of analysis, I am happy to look at other stocks on request and evaluate them purely from a fundamental perspective. This will make the analysis shorter. However, you should never ignore the qualitative aspects (competitive advantage, market, management, etc.)! But that is up to you.
Suggestion:
Please write in the comments if you would like to see a fundamental valuation of a specific stock. The analyses should then be short and to the point with the most important findings. Feel free to link me to other posts with the request for an analysis. But bear with me, I will only analyze stocks that I find convincing and exciting :) But as is so often the case here too... "he who doesn't ask, doesn't win" :)
As usual, you can also find my collected analyses under the following link:
https://app.getquin.com/activity/YyIXcpDduz?lang=de&utm_source=sharing
As always, no investment advice!
Sources:
[1] https://pages.stern.nyu.edu/~adamodar/New_Home_Page/datacurrent.html
[2] https://ch.marketscreener.com/kurs/aktie/7C-SOLARPARKEN-AG-16783954/fundamentals/
[3] https://ch.marketscreener.com/kurs/aktie/ENERGIEKONTOR-AG-435840/fundamentals/
[4] https://ch.marketscreener.com/kurs/aktie/SOLAREDGE-TECHNOLOGIES-I-21452890/fundamentals/
[5] https://www.solaredge.com/de/corporate/about-us
[6] https://www.energiekontor.de/unternehmen/kurzportrait.html
[7] http://www.solarparken.com/index.php
[8] https://www.boerse.de/kgvs/KGV-Euro-Stoxx-50
[9] https://aktie.traderfox.com/visualizations/DE0005313506/EI/energiekontor-ag
[10] https://pwc-tools.de/kapitalkosten/
[11] https://aktie.traderfox.com/visualizations/DE000A11QW68/ETR/7c-solarparken-ag
[12] https://aktie.traderfox.com/visualizations/US83417M1045/DI/solaredge-technologies-inc
[13] http://www.solarparken.com/Finanzberichte/20220331%20Bericht%20Deutsch%20.pdf
[14] https://eulerpool.com/aktie/DE000A11QW68/A11QW6/HRPK.DE/7C-Solarparken-Aktie
[15] https://eulerpool.com/aktie/US83417M1045/A14QVM/SEDG/Solaredge-Technologies-Aktie
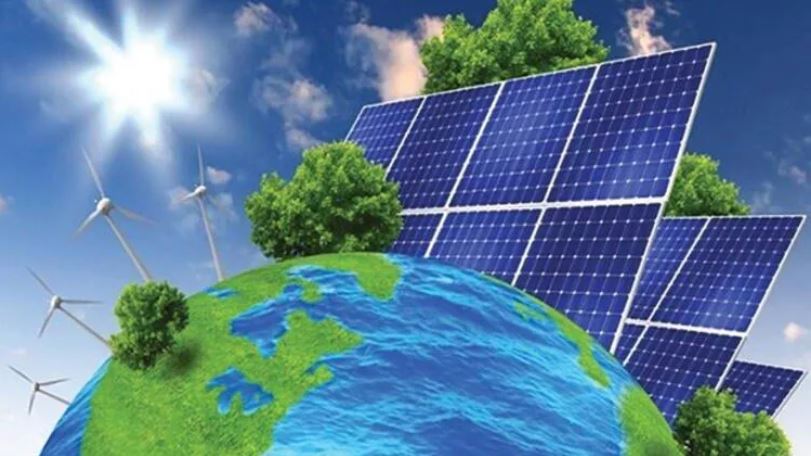
Graphics Source: https://www.hurriyetdailynews.com/legislation-to-promote-use-of-renewable-energy-172057
Company homepage:
https://www.energiekontor.de/index.html
Share presentation on request:
@Jh -->Solaredge
@Wellenreiter -->7c Solarparken
@Koenigmidas -->Energiekontor


