As always in December and January, the busy season for accountants hit me hard, which is why there was nothing from me here on GQ for a long time. A time when accountants and public accountants face each other as gladiators in the magician's ring. In the end, only one comes out of the duel unscathed...and you know who that is...the master of the 4 elements HGB, OR, IFRS and Swiss GAAP FER. So here I am, here to give you more basics to get you started in the world of elementary wizardry.
𝘈𝘤𝘤𝘰𝘶𝘯𝘵𝘢𝘯𝘵: "𝘚𝘰𝘮𝘦𝘰𝘯𝘦 𝘸𝘩𝘰𝘰 𝘥𝘰𝘦𝘴 𝘱𝘳𝘦𝘤𝘪𝘴𝘪𝘰𝘯 𝘨𝘶𝘦𝘴𝘴𝘸𝘰𝘳𝘬 𝘣𝘢𝘴𝘦𝘥 𝘰𝘯 𝘶𝘯𝘳𝘦𝘭𝘪𝘢𝘣𝘭𝘦 𝘥𝘢𝘵𝘢 𝘱𝘳𝘰𝘷𝘪𝘥𝘦𝘥 𝘣𝘺 𝘵𝘩𝘰𝘴𝘦 𝘰𝘧 𝘲𝘶𝘦𝘴𝘵𝘪𝘰𝘯𝘢𝘣𝘭𝘦 𝘬𝘯𝘰𝘸𝘭𝘦𝘥𝘨𝘦. 𝘚𝘦𝘦𝘦 𝘢𝘭𝘴𝘰 𝘮𝘢𝘨𝘪𝘤𝘪𝘢𝘯, 𝘸𝘪𝘻𝘢𝘳𝘥"
In order to be able to analyze companies, you need a basic knowledge of how to read and interpret annual reports. In this article, I would therefore like to briefly explain how the individual sections are structured and what information they provide. I am referring exclusively to the financial report. In addition to the financial report, the annual report contains other helpful sections for your due diligence that give you an insight into the company's strategy, challenges, management or risks. These require less explanation, but are no less relevant!
Finally, I will give you a small learning task and link you to the annual report of Novo Nordisk (pharmaceutical company from Denmark - no investment advice, I am invested myself!) and individual questions about it. This way you can check for yourself whether my article has helped you and implement the learning directly. The corresponding solutions are of course available in the comment function.
𝐈𝐧𝐡𝐚𝐥𝐭𝐬𝐯𝐞𝐫𝐳𝐞𝐢𝐜𝐡𝐧𝐢𝐬:
I. Income statement
II. balance sheet
III. cash flow statement:
IV. Learning task
V. Closing remarks
So how do I read and interpret company financial reports correctly?
The financial report is divided into three main sections (income statement, balance sheet, cash flow statement). But what questions are answered in these income statement, balance sheet and cash flow statement statements and what exactly do you do with the answers? I would now like to explain all this to you in more detail. The ABC of financial statements awaits you :)
𝐈. 𝐄𝐫𝐟𝐨𝐥𝐠𝐬𝐫𝐞𝐜𝐡𝐧𝐮𝐧𝐠/𝐈𝐧𝐜𝐨𝐦𝐞𝐞 𝐒𝐭𝐚𝐭𝐞𝐦𝐞𝐧𝐭
Fundamental question that is answered: Is the company profitable?
-->Presentation of the earnings situation!
𝘋𝘪𝘦 𝘌𝘳𝘧𝘰𝘭𝘨𝘴𝘳𝘦𝘤𝘩𝘯𝘶𝘯𝘨 𝘴𝘢𝘨𝘵 𝘢𝘶𝘴:
-How efficient is the company?
-How profitable is the company?
-Where and how could the company make better decisions?
-What costs are incurred and how can these be controlled?
Basic structure:
Turnover - expenses = profit
-Turnover = The turnover of a company is made up of all income that a company generates through the sale of goods or services. [1]
If the costs incurred are deducted from the turnover generated, the result is profit. [1]
-Expenses = periodized expenses of a company for the goods, services and public charges consumed during an accounting period, which are compared with the income in the income statement (otherwise: costs). [2]
Expenses can be broken down into:
-Cost of goods sold: What it costs the company to produce the product in order to generate revenue. Sales minus cost of goods sold = gross profit
Gross margin = gross profit / sales
-Overhead expenses: Costs that are required to keep the business running but cannot be directly allocated to sales or the product/service produced. These can in turn be broken down into fixed costs (no matter how much is produced and sold, the fixed costs never change - e.g. rent) and variable costs (which vary depending on the activity/productivity - e.g. electricity).
Net margin = net profit / turnover
Net profit = profit minus all expenses
Net margin and gross margin and the costs contained therein thus provide information on whether the company has a sensible and efficient cost allocation. Perhaps the company has too high costs for administrative things or even interest on loans, even compared to the competition. It is also possible that the production costs are too high, which affects the margins.
The income statement can be prepared using the total cost method (TCM) or the cost of sales method (COGS). This results in different classification structures. However, the content and informative value is the same.
𝐈𝐈. 𝐁𝐢𝐥𝐚𝐧𝐳/𝐁𝐚𝐥𝐚𝐧𝐜𝐞 𝐒𝐡𝐞𝐞𝐭
Fundamental question that is answered: Is the company healthy?
-->Presentation of the financial situation!
𝘋𝘪𝘦 𝘉𝘪𝘭𝘢𝘯𝘻 𝘴𝘢𝘨𝘵 𝘢𝘶𝘴:
-How much cash does the company have available?
-Can the company pay its bills?
-How high are the liabilities?
-Do the assets cover the liabilities?
-What is the ratio between debt/liabilities and equity (the lower, the better)?
-How high is the equity ratio (equity/assets)?
The balance sheet is made up of
A. Assets/assets:
→Everything you own!
-Cash,
-Inventories,
-Trade receivables from goods and services,
-machinery,
-buildings,
etc.
B. Liabilities
→Everything that is owed to someone in any form!
-Liabilities from deliveries and services,
-Tax liabilities,
-bank loans,
etc.
C. Equity/Equity
→States what you are "worth"!
If you sell all your assets and pay your liabilities, your equity is the value that remains.
Composition of equity:
-Share capital
-Net income/profit for the current year (comes from the income statement)
-Retained earnings (accumulated profits from previous periods - these come from the income statement and are in principle the net profits from previous years)
-Profits withdrawn from the company in the form of dividends.
-Treasury shares
-Capital reserves
Equity is the basis of the relative valuation ratio (market capitalization / equity).
DE: Equity = Assets - Liabilities
ENG: Equity = Total Assets - Total Liabilities
In contrast to the income statement, the balance sheet contains stock figures. In principle, this means nothing other than that my balance sheet is continued over the following years. In the income statement, we always start at 0 on January 1 of a year (if the financial year runs from January 1 to December 31), similar to your tax return. You only have to pay tax on your income in the year in which it is earned (inflow principle) and not cumulatively over the following years. In the same way, sales and expenses are only shown once in the reporting period. The balance sheet, on the other hand, shows all inventory items (machines, inventories, cash, etc.), which can reappear in the following year.
𝐈𝐈𝐈𝐈. 𝐆𝐞𝐥𝐝𝐟𝐥𝐮𝐬𝐬𝐫𝐞𝐜𝐡𝐧𝐮𝐧𝐠/𝐂𝐚𝐬𝐡𝐟𝐥𝐨𝐰 𝐒𝐭𝐚𝐭𝐞𝐦𝐞𝐧𝐭:
Fundamental question that is answered: Can the company survive?
𝘋𝘪𝘦 𝘎𝘦𝘭𝘥𝘧𝘭𝘶𝘴𝘴𝘳𝘦𝘤𝘩𝘯𝘶𝘯𝘨 𝘴𝘢𝘨𝘵 𝘢𝘶𝘴:
-How much cash did the company receive and how is/was it used during the financial year?
A distinction is made as to whether the cash was generated from:
-Operating activities (cash flow from operating activities)
-investment activities (cash flow from investing activities)
-financing activities (cash flow from financing activities)
from
A. Cash flow from operating activities
-Cash outflow from rental payments
-Cash from sales of products/services (as soon as customer pays)
-Cash outflow from tax payments
-Cash outflow from payment of wages and salaries
B. Cash flow from investments (cash flow from investing activities)
-Purchase and/or sale of assets/assets
-Purchase and/or sale of machinery
C. Cash flow from financing activities
-Cash from capital increases
-Cash outflow from dividend payments
-Cash outflow from share buy-backs
-Cash from borrowing
-Cash outflow from loan repayments
Cash at the beginning of the period (01.01.xx) +/- changes during the period (from A,B and C) = cash at the end of the period (31.12.xx)
Cash at the end of the period (31.12.xx) = Cash balance in the balance sheet (asset)
Target:
positive cash flow!
Free cash flow (FCF) = cash flow from operating activities - cash flow from investments
FCF indicates how much cash flow is still available to the company to pay dividends or repay loans at the end of the year. It is freely available to the company. [3] This key figure is therefore very important in balance sheet analysis and for shareholders! It can also provide information on the extent to which the company acts in a shareholder-friendly manner or is more concerned with paying off debts first.
The cash flow statement can be prepared using the direct or indirect method. However, the end result is always the same.
𝐈𝐕. 𝐋𝐞𝐫𝐧𝐚𝐮𝐟𝐠𝐚𝐛𝐞
Go to the Novo Nordisk homepage and open the Annual Report 2021 in the "Investors" section (Homepage: https://www.novonordisk.com/). If you want to skip this learning effect, use the following link, which will open the Annual Report directly as a PDF:
Go to the relevant section and answer the following questions:
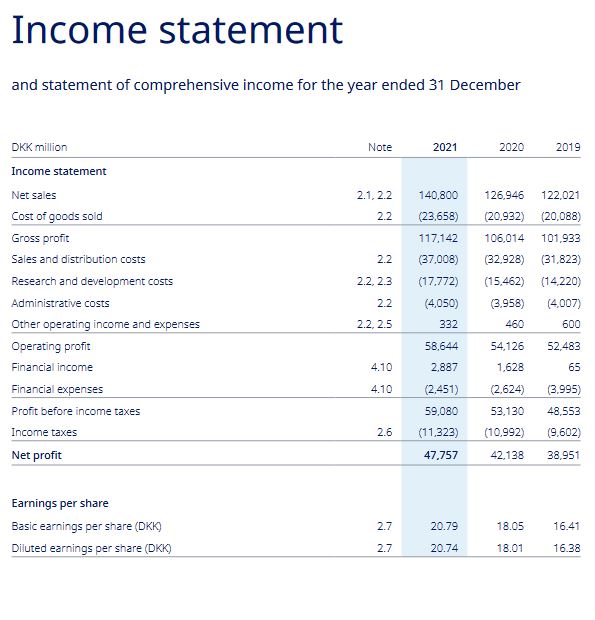
Income statement:
1) What are the following amounts for the financial year 2021 (in DKK million)
a. Turnover or net revenue
b. Cost of goods sold
c. Gross profit
d. Gross margin
e. Net margin
f. EBT*
*EBT = Earnings before taxes
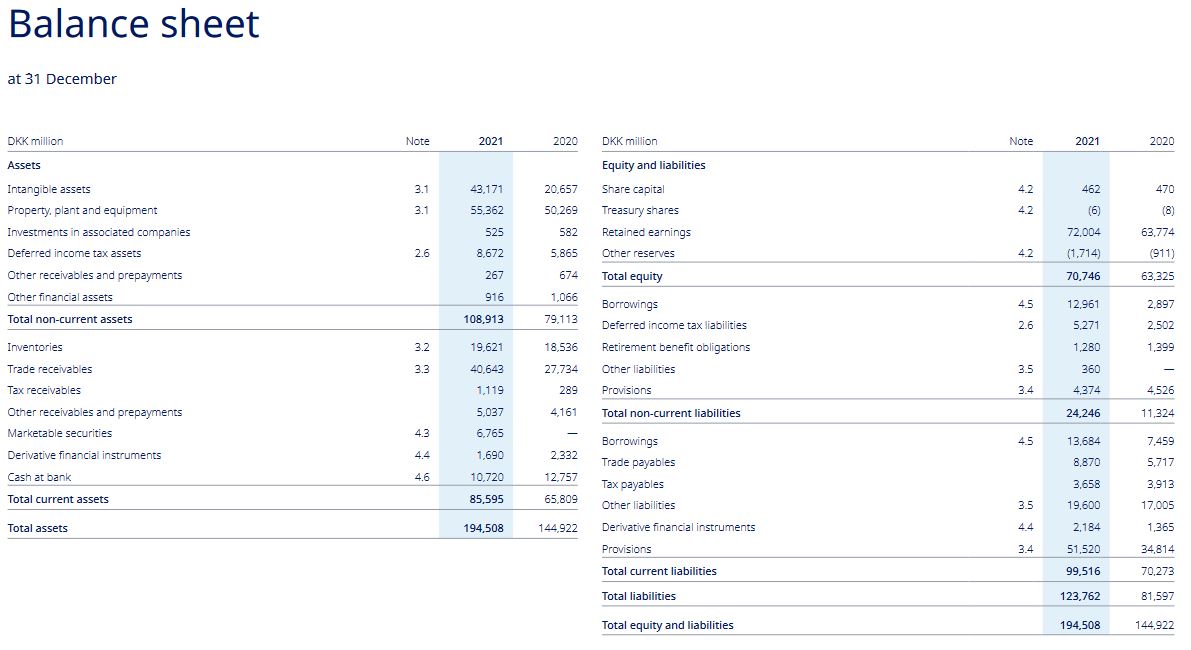
Balance sheet:
2) How high are for the 2021 financial year (in DKK million)
a. Total assets (assets)
b. Total liabilities (liabilities)
c. Shareholders' equity
d. Equity ratio
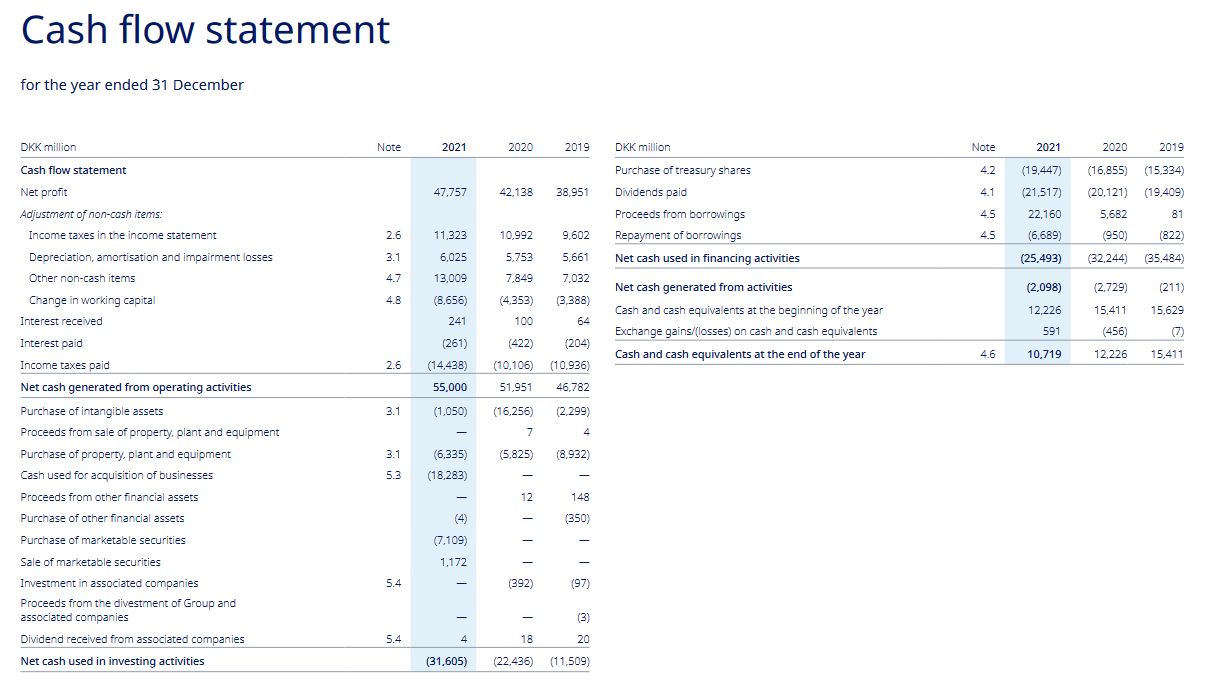
Cash flow statement:
3) What is the free cash flow (FCF) for the 2021 financial year (in DKK million)?
4) How many dividends were paid in the financial year 2021 (in DKK million)?
5) How many shares were bought back by the company in the 2021 financial year (in DKK million)?
𝐕. 𝐒𝐜𝐡𝐥𝐮𝐬𝐬𝐰𝐨𝐫𝐭
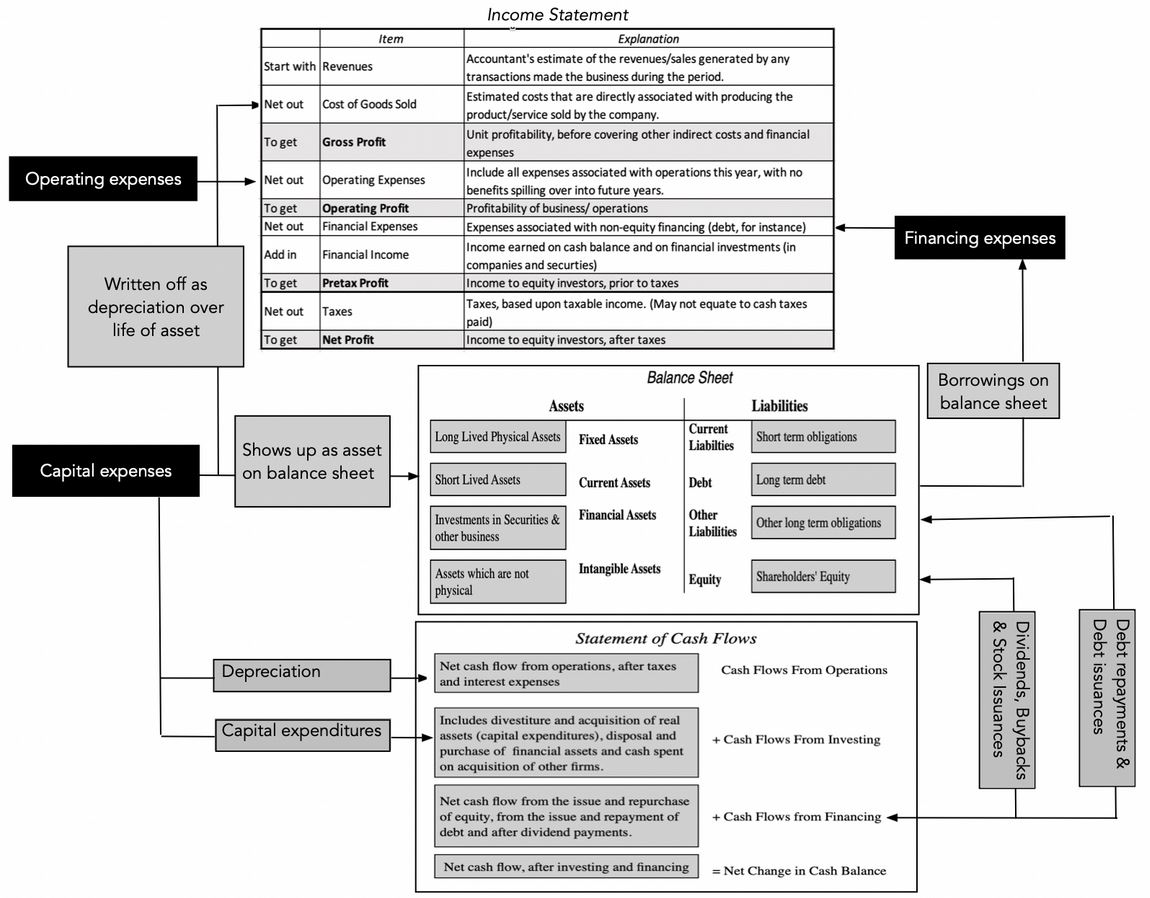
I hope that you were able to take away a lot of useful information from my explanations and tasks. With this post, I wanted to give you the basics of the income statement, balance sheet and cash flow statement. If you have internalized these, please feel free to read my further posts (link follows). Because now you have the tools to understand them even better. You will also be able to better interpret my stock analyses. As a little support, I have attached a nice diagram by Damodaran (I have already introduced him as the "Valuation Guru"), which you can also find on his blog:
https://aswathdamodaran.blogspot.com/
To quote Damodaran here:
"Much of the raw data that you use in corporate finance and valuation comes from accounting statements, and if you do not understand the difference between operating and net income, you are fatally handicapped. If your accounting basics are strong, you can move right along..."
So I hope you understand that accounting basics are essential to be able to carry out in-depth company valuations.
Building contributions:
-Value Investing - Buffett
https://app.getquin.com/activity/XcuRrJwmyP
-The little guide of valuation
https://app.getquin.com/activity/laOUVhfFDI?lang=de&utm_source=sharing
Sources:
[1]
https://www.bwl-lexikon.de/wiki/umsatz/
[2]
https://wirtschaftslexikon.gabler.de/definition/aufwendungen-30077
[3]
https://www.bwl-lexikon.de/wiki/free-cash-flow/
Further sources:
Annual Report Novo Nordisk; https://www.novonordisk.com/content/dam/nncorp/global/en/investors/irmaterial/annual_report/2022/novo-nordisk-annual-report-2021.pdf
https://www.novonordisk.com/investors/annual-report.html
Image:
https://www.merchantmaverick.com/quick-guide-accounting-terms-concepts/