1Yr·

Understand basic trading TA in charts


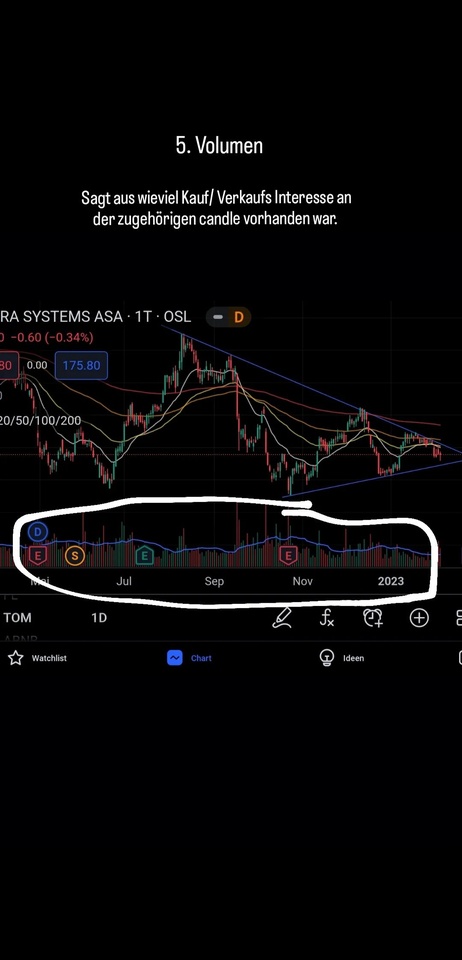
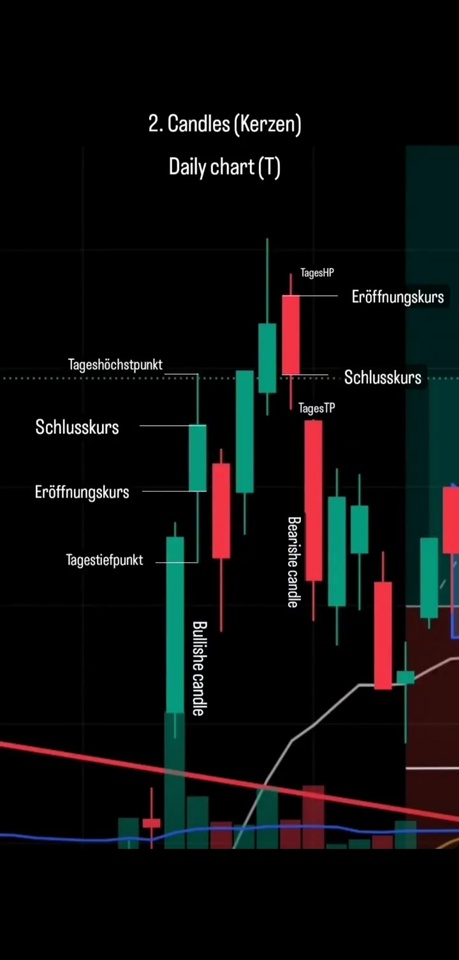
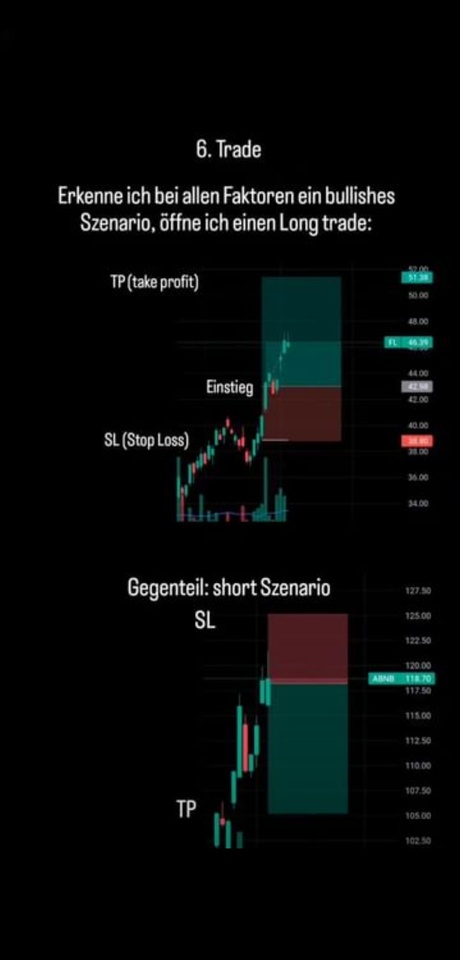
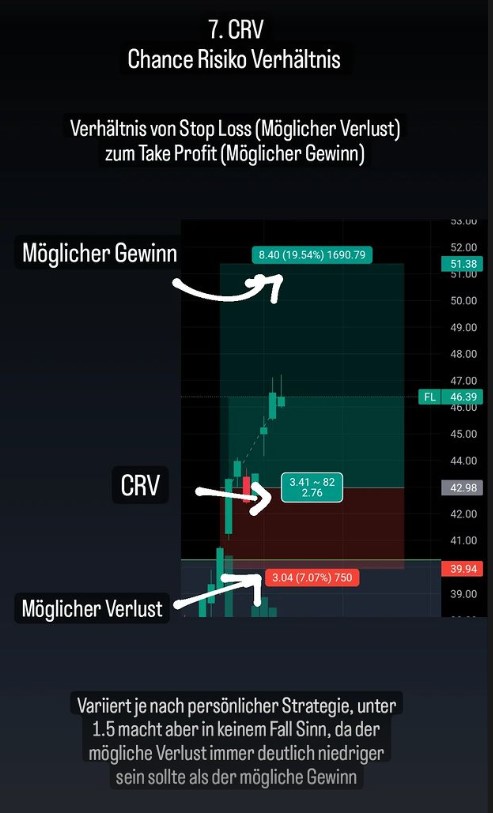
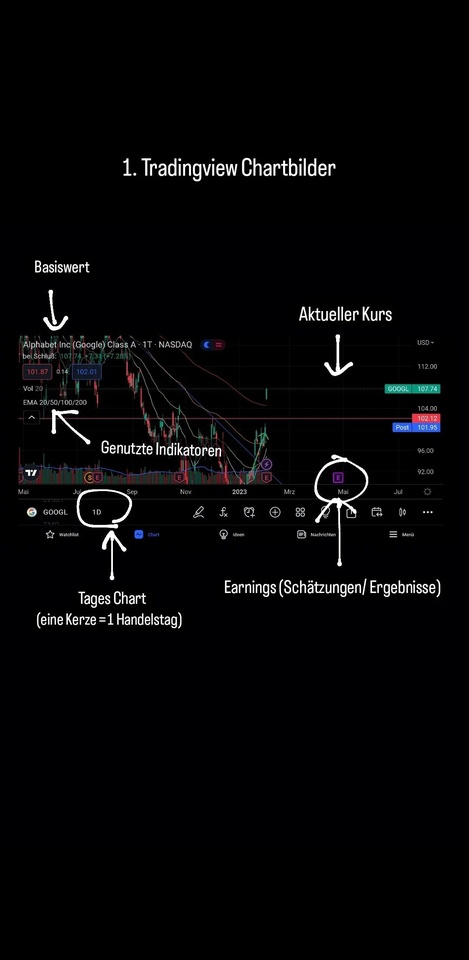
Since there are always questions under posts about TA, here are the absolute basics, which are often considered in a technical chart analysis.


Of course, you will not see exactly these "drawings" in every chart again, but it should give you a rough overview of other TA analyses.


If you are still interested in the topic:

Have a look at the posts of @TradingMelone even if they are not easy to understand as a beginner.

Here are profiles that deal with this:

@Der_Dividenden_Monteur
@CorruptedCaptain
@Enyana
@ThomasHochZwei
@investorsapiens


#trading
#ta
#learn

attachment
attachment
attachment
attachment
attachment
36
48 Comments

profile image
Above all, I am interested in why TA works and only secondarily how it works. @TradingMelone does a good job
2
View all 31 further answers
profile image
The art with TA is to use it correctly and not to look for confirmation of your own wishes. If you look long enough, you will always find a support somewhere. The worst thing you can do is to trim the indicators until it fits. Otherwise TA is mMn a wonderful tool to read Big Data of the stock market.
1
profile image
And how do I become a millionaire? A look at your portfolio shows me that you are very successful with it and I would like to learn more. do you have a Telegram group to join or a course I can book? GaLiGrü
View all 10 further answers
profile image
Once shoulder neck line cut to 0 🙏
Show answer
Deleted User
1Yr
Comment was deleted
Show answer
Join the conversation