I had announced it many times, here is my leverage strategy for the NASDAQ 100 3x lev:
What is the basic idea?
I always trade only the NASDAQ 100 3x lev. The goal is to take the returns in good market phases. Through the leverage, these positive phases are amplified
Now contrary to what 80% of GetQuiners think, the market doesn't always run positive, and you certainly know that leveraged ETFs get uncomfortable very quickly in a bear market.
That's why I use the following (proven effective) strategy as my guide:
In German, but less info: https://www.focus.de/finanzen/boerse/der-laengste-aktienartikel-aller-zeiten-gehebelte-gewinne_id_10951689.html
In summary: One always goes by the original index, not by the leverage paper. As long as one is above the 200 moving average, one can invest, as soon as the NASDAQ falls below it, one converts everything into cash and only invests again when the index is above the 200 again. By using this tactic, one could have earned about 30% annually over the last few decades (taxes excluded). This is because one withdraws reasonably quickly in times of crisis, thereby cushioning them extremely. One comes to about 5 trades per year, so does not have too much to do.
How do I do it exactly?
I modified the strategy a bit because it makes more sense to me then.
- I use a 190 EMA, so that I do not act like many other market participants.
- I invest/sell only when the price is 1.5% above/below the 190 EMA to avoid many 1 day trades
- When I sell, I don't wait with cash in hand, but immediately go short the 3x NASDAQ to profit from a longer term down move if necessary
- As soon as MACD is bullish again, I sell the short and wait with the cash until I can buy the long again
I have played it out from 1995 and the strategy gives very good results in most cases. Even from the big crashes (2000, 2008) you could profit well with the strategy, or not lose much money. Of course, you have to stick to it like an unfeeling creature, here is probably the biggest risk 👌
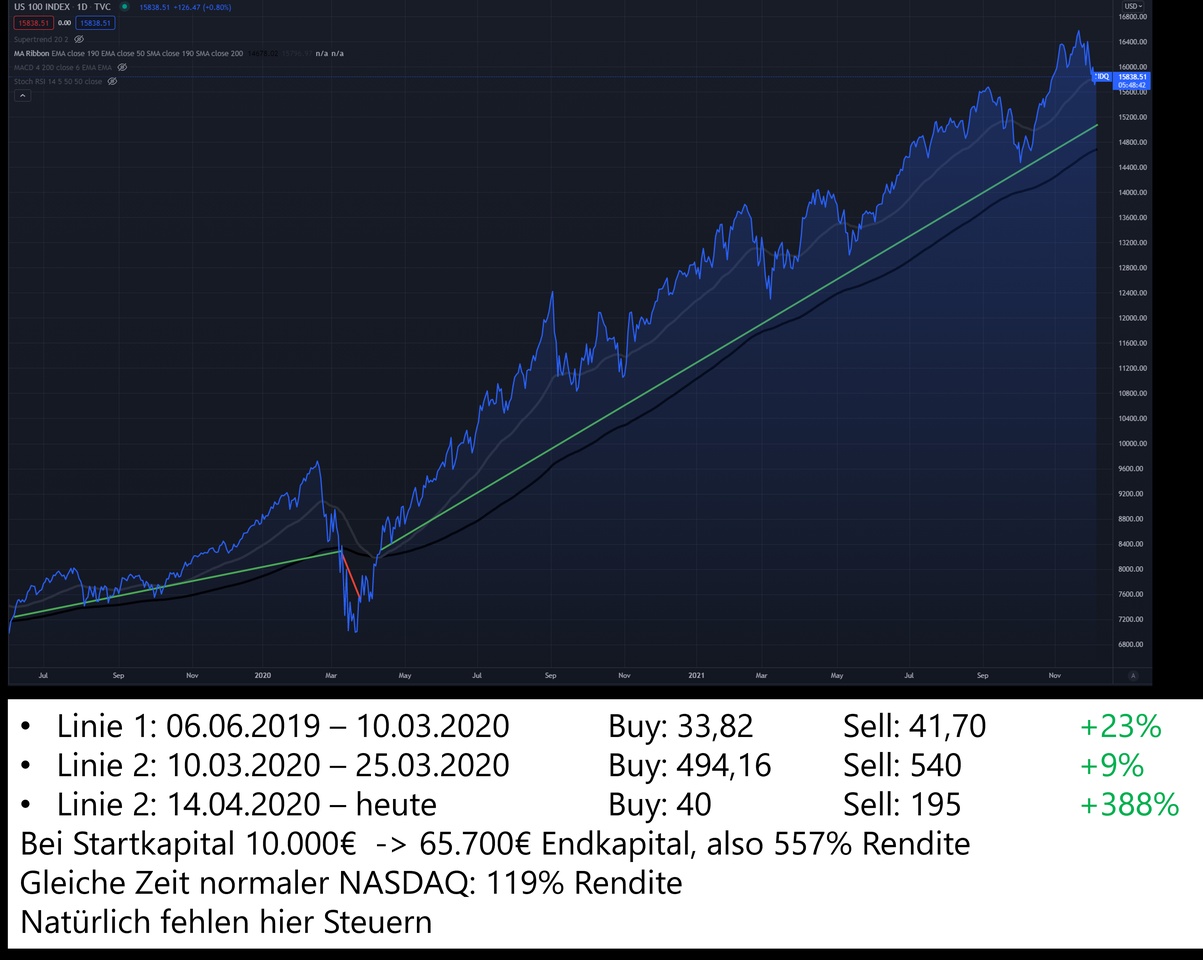
Example image 1: "Crash" of 2019 and the time after.
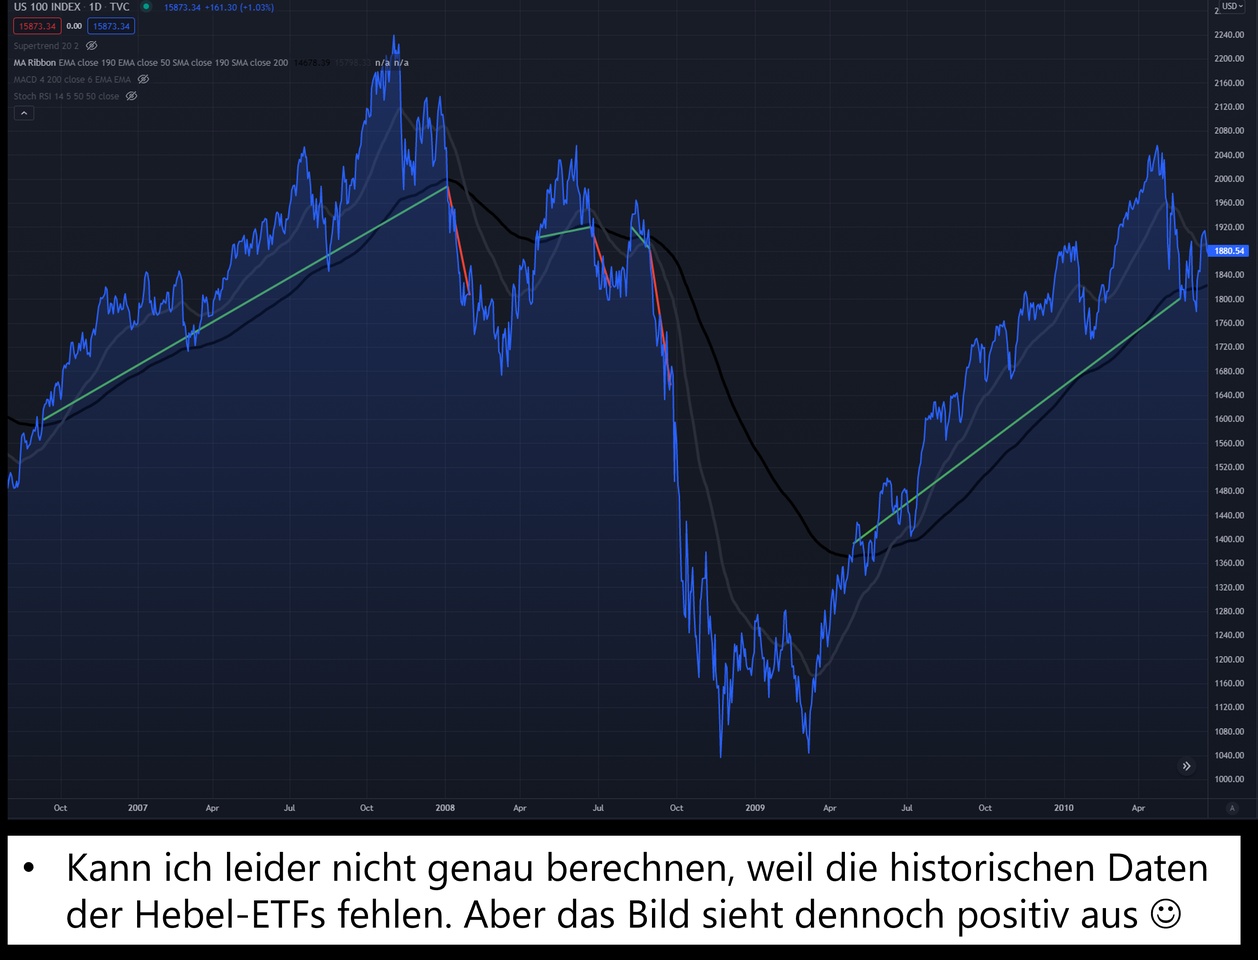
Example picture 2: Crash of 2008
green line = buy long
red line = buy short (previously sell long)
black line = 190 EMA
intentionally shown as an area, so that you can see the colors better
If you have any questions or suggestions, feel free to post them in the comments!
I will post a very transparent update of the strategy every week, feel free to follow me if you are interested. 😁


