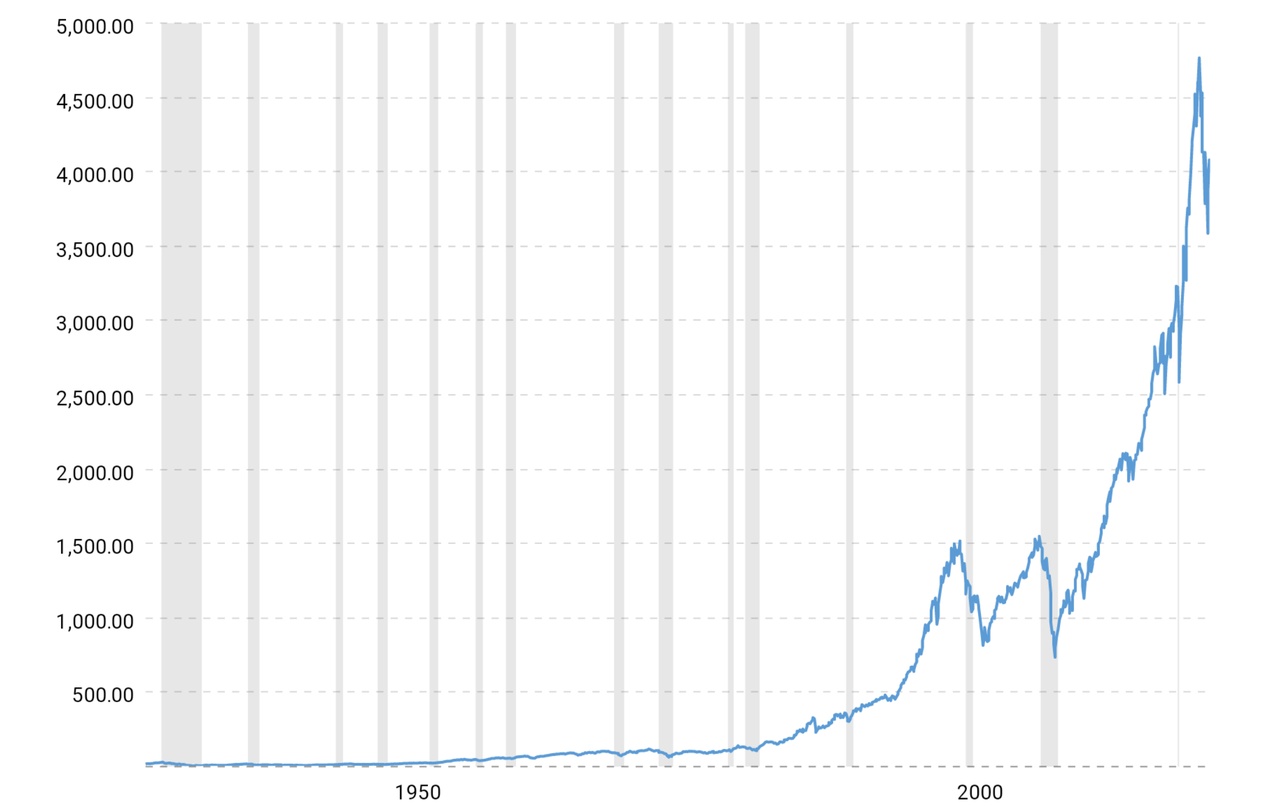
Oh my God, we are in a fat bubble! Just look at the chart in the first picture!
This shows the absolute development of the S&P 500 from 1927 to today. You can clearly see that the performance over the last 10 years has been completely off the charts. We must be in a bubble that will burst with catastrophic consequences!
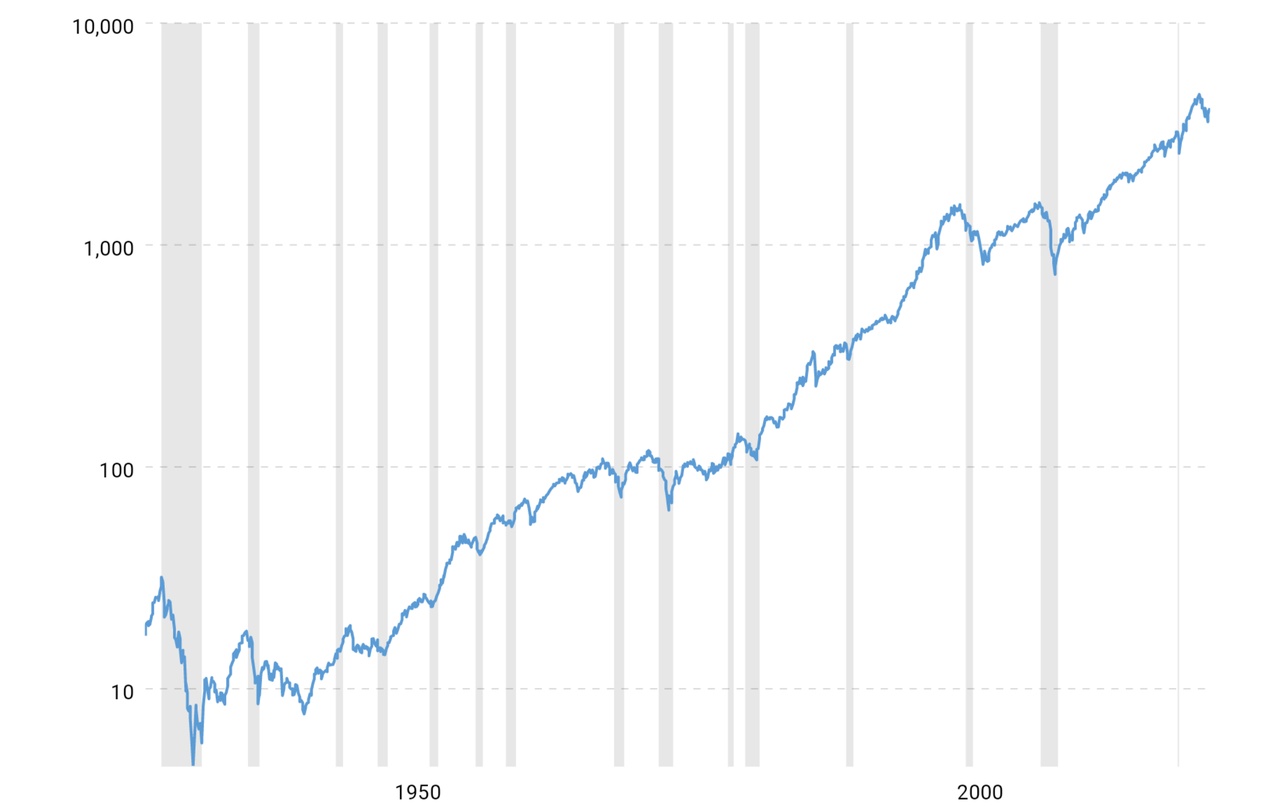
But maybe not. In fact, the 2nd image shows the same chart, only on a logarithmic scale. This is always used when you want to show percentage changes. I.e. in picture 1 I can see that at some point the S&P 500 was valued at less than 30 points and that this is blatantly much less than 4,000 points. But in Figure 2, you can see that the percentage changes over the last 10 years are not really different from the 80 years before that.
It is understandable if the absolute growth in recent years seems like a gigantic rally that must end badly sooner rather than later. But in fact, the growth rates (including the usual fluctuations) are actually the same as they have always been. Nothing out of the ordinary.
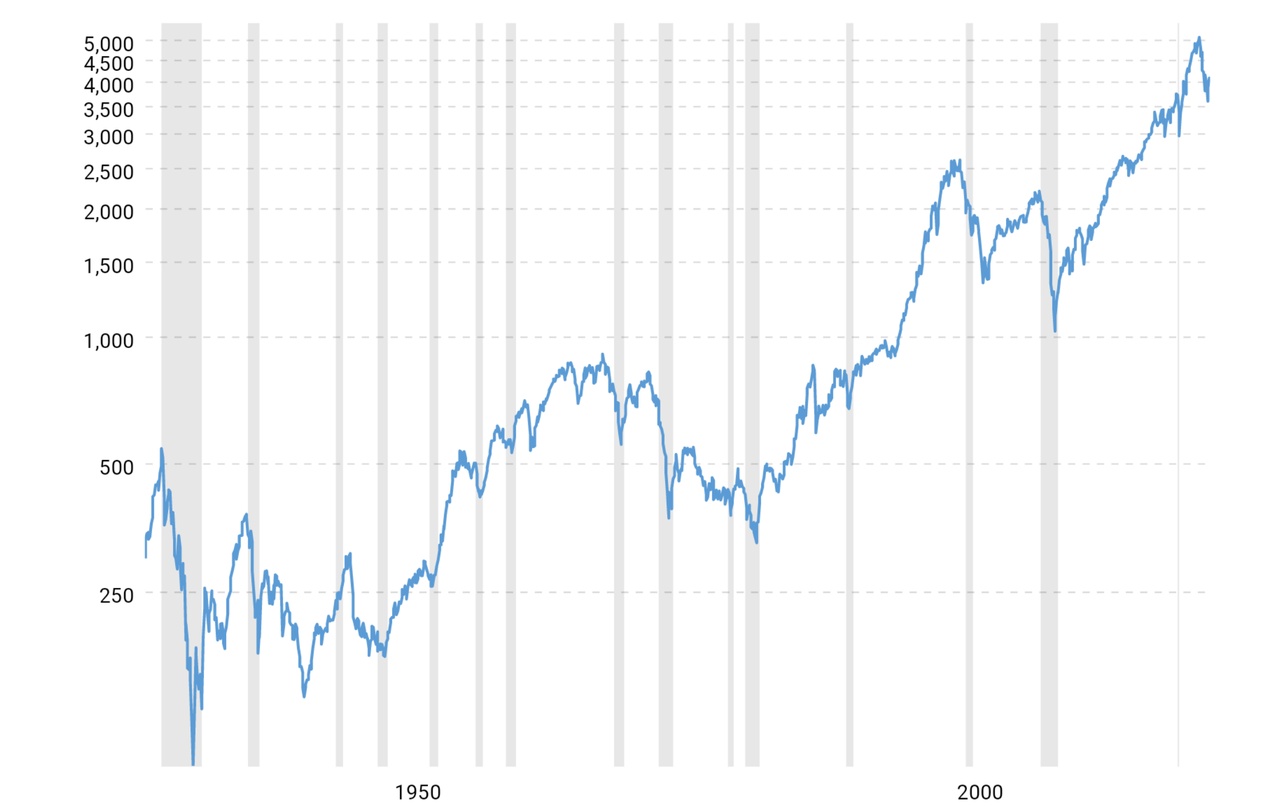
By the way, the 3rd picture shows the inflation-adjusted, logarithmic curve of the S&P 500. There, things are already a bit more off and you can see clear fluctuations. In real terms (taking inflation into account), the stock markets have not been profitable for long periods of time. A long-term investment is therefore all the more important. See also "Correctly assessing the risk of a short investment period": https://app.getquin.com/activity/oyjGfrRRfr
Especially beginners / novices should therefore do their homework and learn to interpret information correctly. The internet and statistics offer a lot of room for manipulation.
Source:
https://www.macrotrends.net/2324/sp-500-historical-chart-data