Motivation in hard times.
So let's be a little transparent here for you.
After I was asked yesterday directly after the return of the last time - Since the beginning of the year it went down also with me by 5.2%.
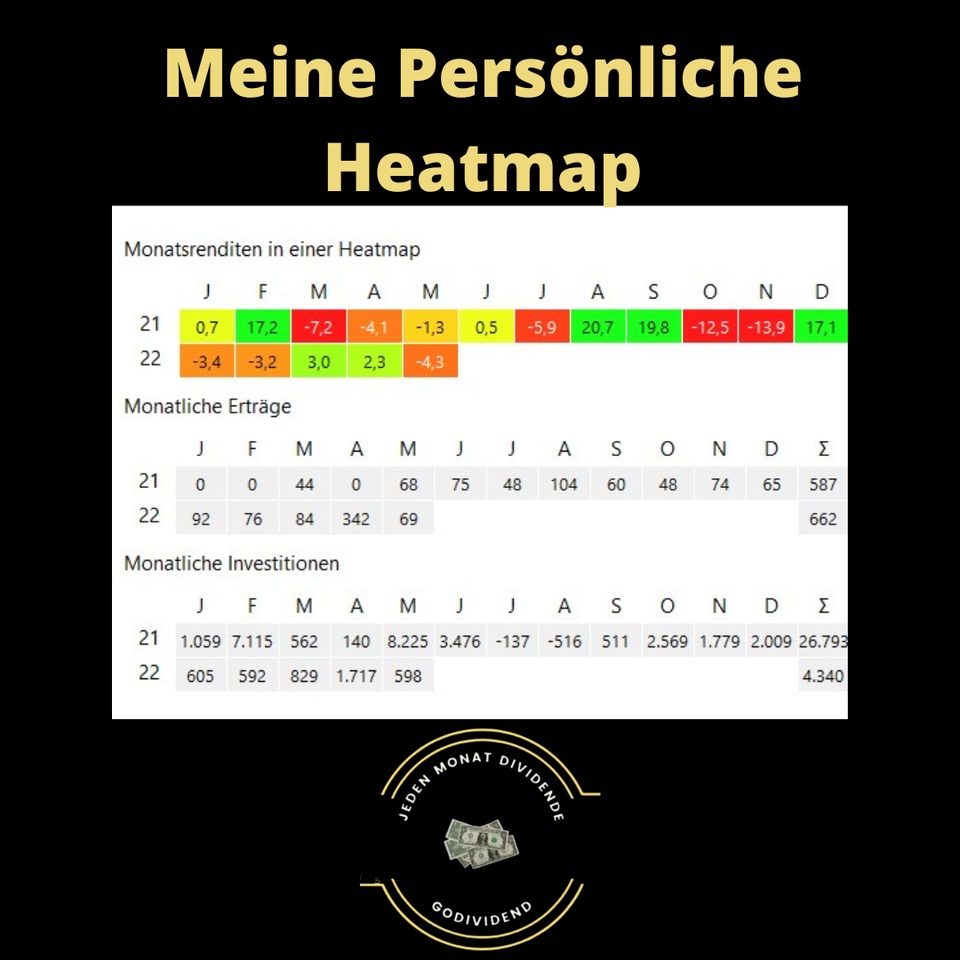
So now but enclosed my heatmap, this shows you the way in the conversion of the depot on my strategy.
And who would have thought it, on dividends 🤷🏼♂️. You can do it, you don't have to, I did it.
The heatmap shows you the period from January 2021 to today. It's not all uphill. There were also some damn bad months last year.
So now motivation: Continue to follow your strategy, but still reconsider individual positions, reassess for you. Does everything fit? Then there is no reason to trade.
TTwor since 01.01.2021 17,68%
Yield 2021 25,1%
Yield 2022 -5.1%
Dividend yield is currently around 4.6% or so
The way is the goal!
I will continue to grow existing stocks this year via my savings plans and reinvest the dividends I receive.
You can also see in the payouts that I have already received as many dividends as in 2021. That gives me courage. That motivates.
Good luck on your way! 💪