---𝐀𝐤𝐭𝐢𝐞𝐧𝐯𝐨𝐫𝐬𝐭𝐞𝐥𝐥𝐮𝐧𝐠---
Jack Henry & Associates
US4262811015
Jack Henry & Associates, Inc. is a provider of technology solutions and payment processing services primarily to financial services companies.[1] The company operates in the following segments: Core, Payments, Complementary, and Corporate and Other. The Core segment focuses on centralized information processing platforms for banks and credit unions, which consist of integrated applications required to process deposit, loan, and general ledger transactions and maintain centralized customer or member information. The Payments segment provides payment processing tools and services, such as ATM, debit, and credit card processing; online and mobile bill payment solutions; and risk management products and services. The Complementary segment offers additional software and services that can be integrated into the core solutions or used independently. The Corporate and Other segment includes hardware revenue and costs, as well as operating costs not directly attributable to the other segments.[3]
In the same way, JH can offer credit unions/banks tools that are normally run through fintechs (open banking, APIs, treasury management, payment solutions, etc.). Here they are also somewhat ahead of their competition.
In summary: Almost all operational processes of a bank/credit union run through JH. Once you have decided to use JH, it is difficult for a bank to get rid of it. They focus mainly on small and medium-sized banks (asset volume < USD 50 billion).
Due to this all-encompassing service, JH generates very robust/recurring and therefore calculable cash flows (fees and regular services - so-called "recurring revenues"), similar to SAP. To get a better reference to the share, one can therefore compare the business model, except that JH operates in the financial/banking sector. Thus, regular license revenues/fees account for 60% of total revenues. When I analyze JH's future reports, I therefore welcome it if the percentage continues to rise, as such revenues recur every year without much effort.
According to company homepage [5]:
"JHA provides more than 300 products and services that enable our customers to process financial transactions, automate their businesses, and succeed in an increasingly competitive marketplace. Our three brands - Jack Henry Banking, Symitar, and ProfitStars - support financial institutions of all sizes, diverse businesses outside the financial industry, and other technology providers."
Key figures:
-KGV 2022: 38.3 [1]
-KGV 2023e: 35.4 [1]
-PEG (P/E/growth rate): 38/6%= 6.33 (rule of thumb: < 1 = very favorable).
-EBT multiple: 34 (Buffet's target <10)
-Dividend Yield 2022: 0.99% [1]
-Dividend yield 2023e: 1.03% (no decrease for 32 years; annual increase for 32 years) [1]
-Goodwill: 52% of equity; 29.4% of total assets; 2.2x earnings 2021 [2]
-Sales growth 10 years: 6.16% p.a. [4]
-EBIT growth 10 years: 6.3% p.a. [4]
-Distribution ratio: 32.1% on free cash flow and 40.1% on earnings [3]
Heading - What would Buffet say (data from Annual Report 2021 [2]):
Criteria to be read in detail: https://app.getquin.com/activity/XcuRrJwmyP
Income Statement:
-Research and Development: 27% of gross profit (2021+2020)-->positive! (Buffet's target: max 30-40% of gross profit)
-Sales/administr. and other overhead: 11% of sales/27% of gross profit (2021+2020)-->positive!
-Gross margin: 40% -->positive! (Buffet's target: min. 40%)
-Net margin: 17.7% -->good! (Buffet's target: >20%)
-Interest expense: 0.2% of operating profit-->positive (Buffet's target: <15%)
Balance Sheet:
-Eigene Aktien (Treasury Shares): 29,792,903 shares per Juni 2021-->Finds Buffet awesome!
--Debt < 4xEBIT: Verschuldung 0,05 Mrd USD; EBIT 0,4 Mrd USD -->hardly any debt!
Cash flow statement:
Capital Expenditures: 162M (of which 128M is computer software, which is always the largest item): 52% of net income (lowered from 66% in 2020 and 70% in 2019)-->in order due to positive performance (Buffet's goal: <50%)
-->shareholder value primarily through share buybacks (see treasury shares), dividend and steady/moderate growth (approx. 6-8% p.a.).
Moat:
JH is a classic second-tier value stock. They have virtually no debt, regular recurring cash flows, and good margins. Buffet's metrics are thus validated in many ways. In addition, JH could benefit in a higher interest rate environment, as banks are happy to spend more and invest in JH services as a result.
Peer Group/Competition:
Broadridge Financial Solutions
-P/E: 31.14
-PEG: 31.14/10.4% (10Y EBIT growth) = 2.99
Fidelity National Information Services Inc.
-KGV 2021: 132
-PEG: 132/n.a - 0.04%, therefore assumption analogous to JH 6% (10Y EBIT growth) = 22
Fiserv
-KGV 2021: 47.36
-PEG: 47.36/9.92% (10Y EBIT growth) = 4.77
Conclusion:
I think JH is great! As a value investor, there is hardly anything better, purely from the key figures! In peer comparison they are better positioned. Their margins and pricing power are significantly stronger! The balance sheet makes the better impression on me. Nevertheless, they are not cheaply valued right now. However, I would find a P/E ratio of 25-30 quite justified and reflects a certain premium, which one must accept. Given the market situation and the financial set-up, I am willing to pay a premium for JH. Broadridge looks even cheaper at first glance. However, their margins (gross margin around 28%) are significantly worse. EBIT growth was actually down in 2019 and 2021. And it is the margins that are the big + at JH compared to the competition. I guess this is partly because they are always leading in customer surveys. This customer satisfaction also allows them to demand higher prices.
You also have to remember that JH has performed very well in recent weeks. Compared to the peer, JH has even outperformed by a long way, if not left the competition miles behind. This probably also explains the increased valuation. Because of this, one should perhaps wait a little longer before entering the market. However, JH shows that diversification pays off. JH is one of the stocks that has swum against the tide and has done my portfolio good in terms of returns.
Disclaimer: I am invested myself! No investment advice!
FYI:
The sources used are my standard sources for various analyses (Traderfox, Marketscreener, Stockfinder, Annual Report).
Sources:
[1] https://ch.marketscreener.com/kurs/aktie/JACK-HENRY-ASSOCIATES-9781/unternehmen/
[2] https://ir.jackhenry.com/static-files/06ec52b3-c740-4355-9b76-5102904383fb
[3] https://aktienfinder.net/dividenden-profil/Jack%20Henry%20%20Associates-Dividende
[4] https://aktie.traderfox.com/visualizations/US4262811015/EI/jack-henry-associates-inc
[5] https://www.jackhenry.com/more-from-jha/pages/about-us.aspx
Graphs Source:
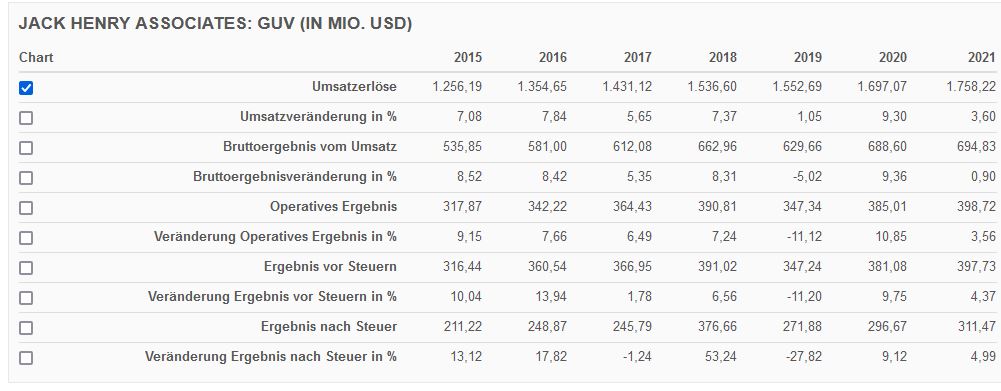
Revenue Overview: https://www.finanzen.net/bilanz_guv/jack_henryassociates
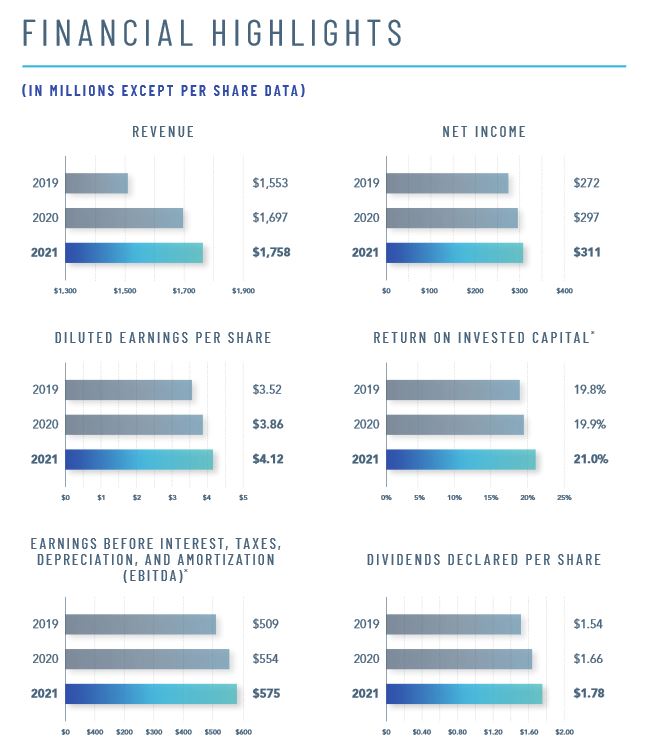
Financial Highlights: Annual Report 2021
Company Homepage:
https://www.jackhenry.com/pages/default.aspx


