
Late April 2025 marks a turning point for the dry bulk market. Capesize vessels surge on seasonal iron ore demand, Panamax thrives on Atlantic grain and mineral trades, Supramax/Ultramax diverges by basin, and Handysize battles persistent oversupply. Softened U.S. port fees ease pressures, Chinese steel production cuts loom, and recycling markets brace for tariff-driven volatility. This sector is a freighter powering through global currents—let’s navigate its journey.
⏬ Capesize Market: Surging on Seasonal Strength
Rate Rally
Capesize vessels, the giants of iron ore and coal transport, are charging forward with momentum. The Baltic Capesize Index (BCI) 5TC rises to $15,667 per day (up from $13,774 earlier in the week), with average rates reaching $15,307 by April 24, a 10% week-on-week gain. The Western Australia-to-China (C5) route climbs 10% to $7.755 per tonne, with 170,000-tonne cargoes from Dampier-to-Qingdao fixed at $7.35 and Port Hedland-to-Qingdao deals in the low $7s. Brazil-to-China (C3) advances to $19.485 per tonne, fueled by fixtures like a 190,000-tonne cargo from Tubarao-to-Qingdao at $19.00—seasonal vigor drives this ascent.
Cargo Catalysts
Northern Hemisphere weather improvements boost iron ore volumes, aligning with historical seasonal trends. West Australia sees healthy demand for early-to-mid-May cargoes, with second-half May and June bookings emerging. East Australia’s mineral exports grow, while West Africa-to-China trades (e.g., 170,000 tonnes at $19.85) add impetus. Pacific tonnage tightens as owners ballast west, shrinking spot availability. Record bauxite shipments from Guinea (45% above 2024 year-to-date) bolster Atlantic routes, though Australian iron ore exports trail 3.1% behind last year. Brazil’s 3.6% export growth supports fixtures—cargo flows propel Capesize’s robust recovery.
Global Forces
U.S. port fees ($18-$33 per net tonne by 2028) exempt bulkers under 80,000 dwt and ballast vessels, sparing Capesize significant costs. U.S.-China tariff negotiations (potentially easing to 50-65% from 145%) lift market sentiment, but Chinese steel output reductions (up to 75 million tonnes) and India’s rising domestic demand curb iron ore exports. China’s 5% GDP growth target relies on stimulus, which could spark Q3 commodity demand. A 25-year low Capesize orderbook and aging fleet (15% over 20 years) signal supply constraints—seasonal tailwinds and tight tonnage fuel Capesize’s bullish outlook.
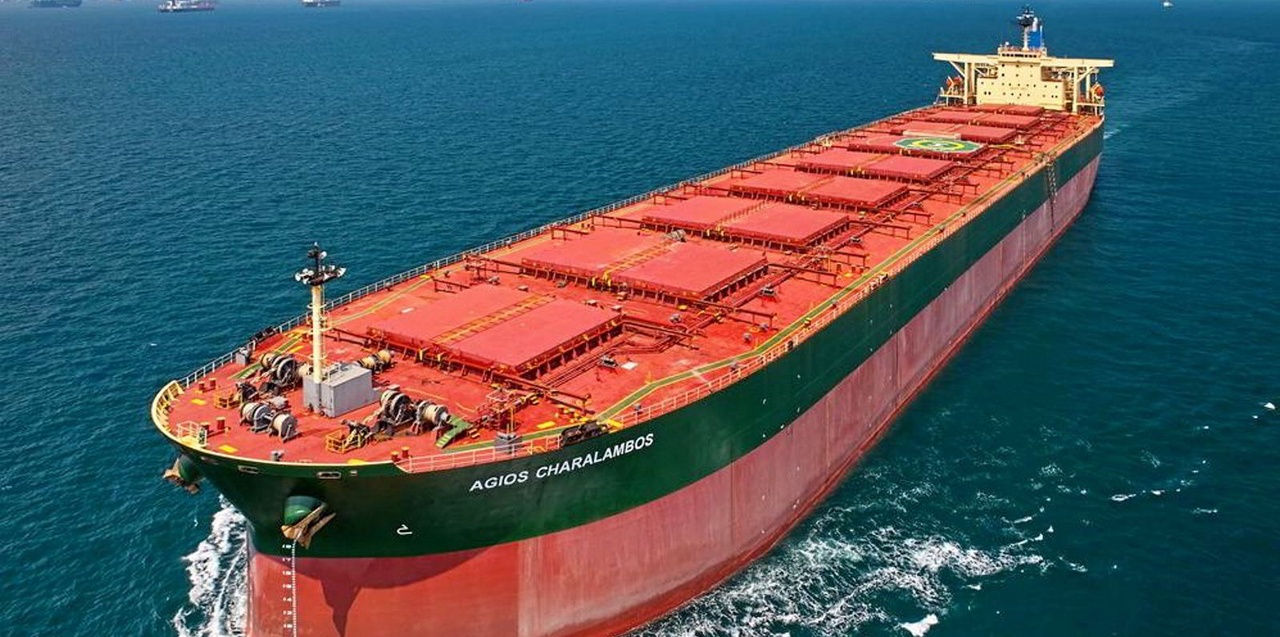
184,872-dwt Capesize bulker Agios Charalambos (2003 built) - For illustrative purposes
⏳ Panamax Market: Atlantic Dominance
Earnings Boom
Panamax vessels, versatile carriers of grain and minerals, excel in the Atlantic. North Coast South America-to-China fixtures hit $20,000 daily for 82,000-dwt vessels, while transatlantic grain routes reach $14,000-$15,000. Indonesia-to-China period charters secure $15,500 for 5-8 months on an 82,000-dwt ship. Pacific rates hold steady at $12,000 for North Pacific grain, bolstered by East Australian minerals. The Baltic Panamax Index reflects consistent gains, with Atlantic demand outshining Asia—Panamax capitalizes on regional strength.
Regional Dynamics
Atlantic vessel availability tightens off the Continent, balancing steady grain shipments from East Coast South America, though an early June slowdown looms. Pacific markets firm as Indonesian tonnage absorbs Chinese coal demand, but high Chinese inventories cap upside. North rallying Atlantic transatlantic runs benefit from U.S. Gulf activity, and South America’s fronthaul surge drives fixtures. Limited period charters and rising forward freight agreement (FFA) values signal optimism, but Asian grain cargoes from the North Pacific remain quiet—Atlantic momentum shapes Panamax’s trajectory.
External Pressures
U.S. port fee exemptions for sub-80,000 dwt bulkers shield Panamax, with only 9% of 2024 U.S. port calls affected. U.S. tariffs on Canadian and Mexican steel (25%) risk depressing global scrap prices, impacting recycling markets. Trade war risks could dent industrial activity, though rerouting (e.g., U.S. coal to Asia) may boost tonne-miles. China’s steel production cuts and India’s 5% annual steel growth absorb iron ore, but potential stimulus could lift Q3 demand—Panamax sails with Atlantic-driven confidence, monitoring global shifts.
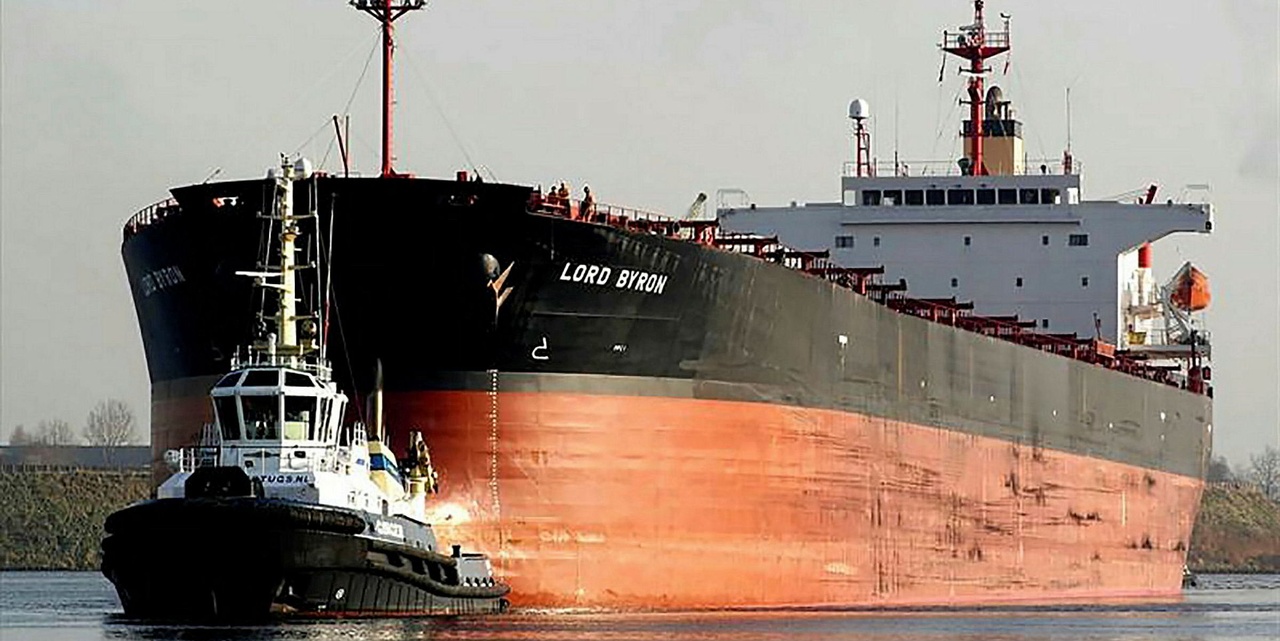
76,800-dwt Panamax bulker Lord Byron ( 2005 built) - For illustrative purposes
⏱️ Supramax/Ultramax Market: Regional Divide
Rate Contrasts
Supramax and Ultramax markets split sharply by geography. In Asia, rates rise with a 63,000-dwt vessel fixing South Africa-to-China at $17,000 plus a $170,000 ballast bonus, and a 54,000-dwt ship securing Bontang-to-China at $16,000. South China-to-West India runs hit $17,000 for 63,000-dwt vessels. The Atlantic lags, with a U.S. Gulf Ultramax fixing transatlantic at mid-$14,000s and Continent-Mediterranean rates softening. Baltic Supramax indices show Asian routes up 5%, while Atlantic trades stagnate—regional divergence defines this market’s rhythm.
Tonnage Trends
Asian demand from Indonesia and South Africa tightens tonnage, with fresh enquiries sustaining rates. Atlantic markets weaken as Continent-Mediterranean and U.S. Gulf see limited activity and growing tonnage lists. Late-week South Atlantic gains offer some relief, but oversupply persists. India’s iron ore export slump (47% of Supramax cargoes) hits Paradip and Dharma ports (83-87% iron ore), pressuring rates. Period charters remain slow, with a 58,000-dwt ship fixing at mid-$11,000s for 4-6 months—Asia’s buoyancy contrasts with Atlantic inertia.
Broader Forces
U.S. port fees spare sub-80,000 dwt vessels, easing Supramax/Ultramax concerns. China’s steel output cuts and India’s domestic ore demand (300 million tonnes by 2030) curb exports, challenging Supramax rates. U.S. tariffs on steel exporters (Canada, Mexico) risk flooding global markets, depressing scrap prices and impacting recycling. Rerouting to Asia and potential Chinese stimulus provide upside, but Atlantic oversupply limits gains—Supramax/Ultramax navigates a split market with guarded optimism.
⏸️ Handysize Market: Wrestling Oversupply
Rate Challenges
Handysize vessels, the smallest bulk carriers, face persistent headwinds. Mediterranean rates slip, with a 33,000-dwt ship fixing Damietta-to-South America at $7,000. South Atlantic holds firm at $13,500 for Brazil-to-Continent, and U.S. Gulf reaches $14,250 for SW Pass-to-Central America. Pacific rates stagnate at $9,750 for Hakata-to-SE Asia runs. Q1 time-charter equivalent (TCE) earnings average $10,252 per day (down from $12,150 in Q4 2024), outperforming benchmarks by 21%. The Baltic Handysize Index drops 23.21% year-on-year—oversupply dims this market’s spark.
Market Sentiment
Both basins see subdued activity, with Continent-Mediterranean weakening and U.S. Gulf tonnage lists lengthening. South Atlantic benefits from steady demand, but Pacific markets falter despite fresh enquiries. India’s iron ore export decline (25% of Handysize cargoes) weighs on rates as domestic steel demand grows. Recycling markets see Handysize sales (e.g., 23,600-dwt vessel at $448 per ldt, 37,000-dwt at $450 per ldt), driven by tariff fears. Fleet coverage at $13,117 per day for 43% of 2025 days offers stability—Handysize perseveres, seeking new trade lanes.
Influencing Factors
U.S. port fee exemptions for sub-80,000 dwt vessels protect Handysize, with minimal impact on 2024 U.S. port calls. U.S. steel tariffs risk oversupplying global markets, depressing scrap prices and hurting recycling. China’s steel cuts and India’s infrastructure push (25 million housing units by 2030) curb ore exports, but potential steel imports via Handysize offer hope. Rising scrapping (e.g., 28,200-dwt vessel at $465 per ldt) could tighten supply if rates weaken—Handysize endures oversupply, banking on rerouting and stimulus.
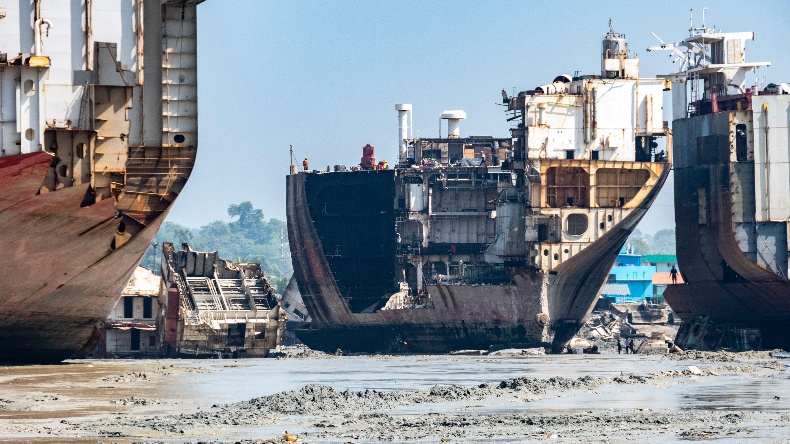
Ship-breaking outside Chittagong - For illustrative purposes
🌐 What’s Moving It: Commodities and Global Trade
Commodity Dynamics
Seasonal weather improvements lift iron ore volumes, with Australia’s exports (down 3.1% year-to-date) and Brazil’s growth (up 3.6%) driving Capesize and Panamax. Guinea’s bauxite exports (45% above 2024) bolster Atlantic routes. China’s steel production cuts (75 million tonnes) and India’s domestic demand (300 million tonnes by 2030) reduce iron ore exports, impacting Supramax and Handysize. Coal demand hits four-year lows, but Pacific coal cargoes rise. Syria’s wheat imports (6,600 dwt) signal new Handysize opportunities—commodity shifts shape this market’s course.
Trade and Policy Shifts
U.S.-China tariff talks (50-65% vs. 145%) and softened port fees (affecting 9% of 2024 U.S. port calls) boost sentiment. U.S. steel tariffs on Canada and Mexico (25%) risk flooding global markets, depressing scrap prices. China’s 5% GDP target depends on stimulus, potentially sparking Q3 commodity demand. Rerouting (e.g., U.S. coal to Asia) and low orderbooks (4.4% geared fleet growth in 2025) support tonne-miles. Trade war uncertainties and stimulus prospects define the horizon—global dynamics steer the dry bulk path.
🌐 Market and Stocks: Rallying Through Volatility
Stock Momentum
Dry bulk stocks spearhead a 1.8% surge in the Dow Jones US Marine Transportation Index, with the SonicShares Global Shipping ETF $BOAT up 2.5%. Himalaya Shipping $HSHP (+2,01%) leaps 7.7% to $4.90, Golden Ocean $GOGL climbs 7.5% to $7.57, and Seanergy Maritime $SHIP (-0,7%) gains 4%. Q1 bulker sales plummet 58% (77 transactions vs. 182 in 2024), with 15-year-old 80,000-dwt Panamax values down 22% to $14.4 million, reflecting tariff concerns. Golden Ocean’s merger with CMB.Tech (0.95 share exchange) divides investors, valuing shares at $14.49—stocks rally but face uncertainty.
Investor Perspectives
Capesize rates are poised to rise into mid-May, with FFA May contracts at $18,446 per day, driven by seasonal iron ore flows. Trade war risks could dampen demand, but rerouting may boost tonne-miles. A 25-year low Capesize orderbook signals supply squeezes, with no newbuilding slots before 2028. BlackRock trims its Genco $GNK (+4,64%) stake to 8.1% (from 10.1%), while Berge Bulk acquires 7.3%. The CMB.Tech merger removes noise, focusing on fleet growth—investors weigh tariff volatility against supply-driven upside.
Sector Outlook
Softened port fees and tariff relief ease pressures, but Chinese steel cuts and global scrap price risks loom. Low orderbooks (4.4% growth) and rising scrapping (e.g., 43,900-dwt vessel at $485 per ldt) point to 2026 tightness. Stocks trade below net asset value (e.g., Golden Ocean at $14.49 vs. CMB.Tech’s $15.23), offering value if stimulus revives demand. Capesize and Panamax lead, while Supramax/Ultramax and Handysize trail—investors balance short-term risks with long-term potential.

Golden Ocean logo - For illuistrative purposes
🌐 Outlook: Charting Future Currents
Market Projections
Capesize ranges $15,000-$18,000 daily—iron ore and bauxite flows drive gains—bullish. Panamax at $12,000-$20,000—Atlantic strength persists—robust. Supramax/Ultramax at $11,000-$17,000—Asia outperforms Atlantic—mixed. Handysize at $7,000-$14,000—oversupply limits upside—steady. Rerouting to Asia and tight supply signal volatility—2026 emerges as a peak if stimulus materializes.
Strategic Horizons
Capesize could lead if Chinese stimulus revives steel demand, but Handysize risks stagnation without new trades. Panamax’s Atlantic edge ensures stability, while Supramax/Ultramax’s Asian strength highlights adaptability. Tariff-driven steel oversupply and recycling pressures ($448-$485 per ldt sales) challenge margins, but low orderbooks and scrapping offer long-term upside. Investors must navigate trade war uncertainties while betting on supply constraints—strategic moves will define dry bulk’s future.
Your Call
Will Capesize dominate, or Panamax’s Atlantic hull Atlantic surge take the lead? Share your take—let’s master the markets! 🚢
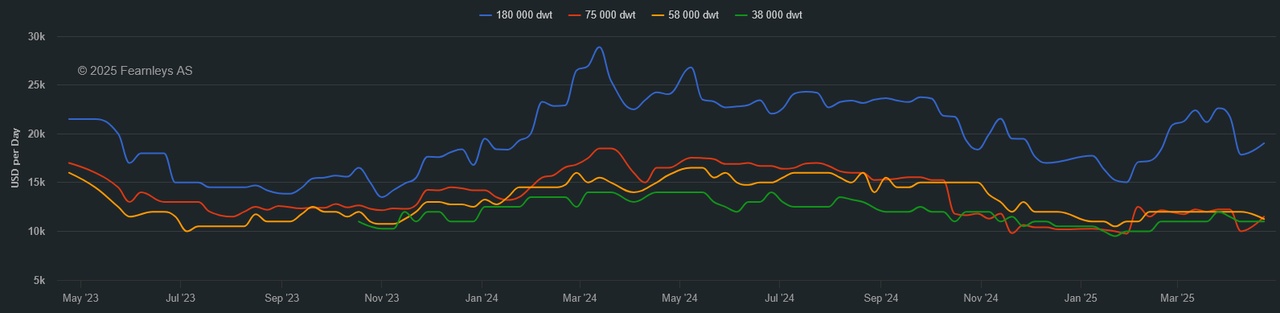
1 Year T/C Dry Bulk - April 23th