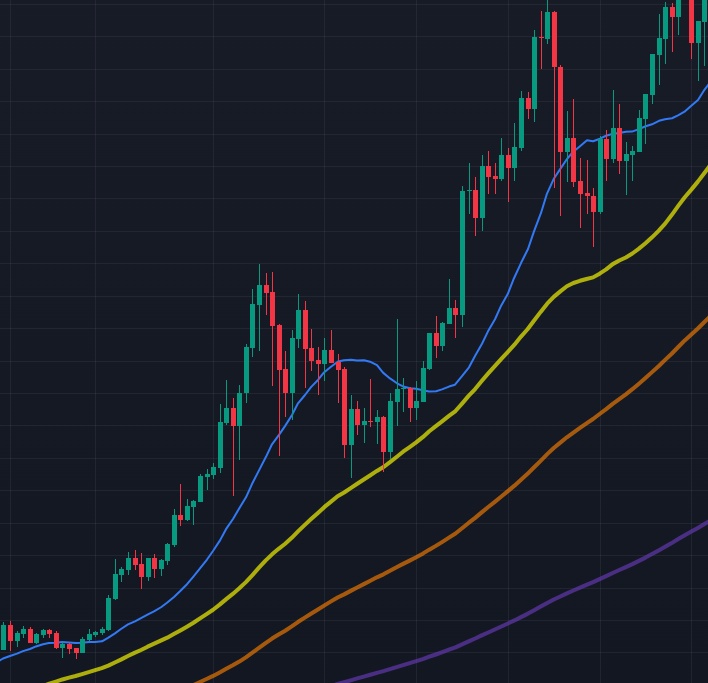
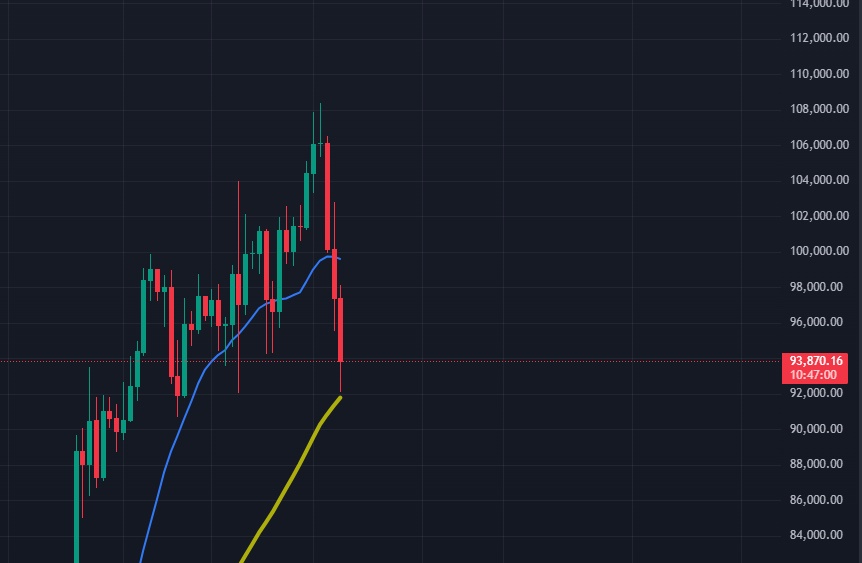
In the last bull run, Bitcoin broke through the 20 day SMA (blue) on the daily chart several times and tested the 50 day SMA (yellow) line. If we close several days above the 50 Day SMA, then we could see a similar behavior of the Bitcoin price as 4 years ago until it goes higher again in January and February. That's the theory, but of course nothing is guaranteed. Historical patterns are sometimes broken.
I remain curious and am eyeing a (re)purchase at $COIN (-7,38%) , $MSTR (-2,3%) and of course $BTC (+1,62%)
(Not Financial Advice)


