Hi folks,
The program continues! This time it's about the financial health of a company. When is a company financially healthy? What figures can I use to determine this and where can I find them in the balance sheet and income statement? Which key figures result from this and how do I interpret them?
As if that wasn't enough dry theory, here's a practical example with $AUTO (+4,26%) from my last article and original excerpts from their financial statement.
The article is definitely written in a beginner-friendly way, with a focus on the context of things.
You are now right to be jubilant. My last few posts have always given rise to lots of new food for thought in the subsequent discussion round in the comments, which then made it into a post a few days later, which in turn provided new food for thought in the comments, which in turn ... you know what I mean.
The last post was my company presentation on the Norwegian storage technology specialist AutoStore. You can read it again here: https://app.getquin.com/activity/hkCUVRxQHh?lang=de&utm_source=sharing
Admittedly, you could argue that it was more of an introduction to the product than the company. @BASS-T I commented logically that I should take a closer look at the balance sheet and figures.
@RealMichaelScott gave additional impetus with his important key figures.
Thanks for that and all the other comments 🙏
So what did I do with it? Well, I sat down, learned to read the balance sheet and P&L and wrote this post as a final exam 🚀
Yesterday, the master himself @TheAccountant89 put together an article on reading and understanding balance sheets, P&Ls and income statements. If you haven't already done so, be sure to read it, like it and leave a ccf! It's worth it!
Before we really get going, I'd like to point out that until a few weeks ago, I was still thinking of "weight and volume check" and not "profit and loss account" when it came to P&Ls due to my job 😅 If I have made any major mistakes or misrepresented something despite careful research and my opinion that I have understood it, please let me know and I will correct it.
What can you expect?
Healthy is,
I. who is not ill
II. who can pay a lot themselves (equity ratio)
III. who can pay off loans flexibly from their own account (gearing)
IV. who can pay off loans with current income (dynamic debt ratio)
V. who plans correctly when spending money (goodwill ratio and depreciation)
I. Healthy people are those who are not ill
From a biomedical point of view, health is defined as the absence of disease. Of course, if we leave out a person's mental, emotional and social health, we are left with physical health, which is limited purely to functionality. Since mental and social aspects are rarely found in profit-oriented companies, especially with regard to their finances and how they deal with them, we want to use the same definition of health to research the well-being of our company in question.
So: Is our patient dying? Does he just need a few (financial) injections? Or can he claim to be in top shape? Let's try to find out using the following key figures.
The whole thing happens in 3 steps for each key figure. First, I'll talk a bit about the theory, a kind of introduction to the key figure in question. Why is it needed, what does it say and how is it calculated? For the formulas, I mainly used Nicolas Schmidlin's book Company valuation and ratio analysis for orientation. I cite it below as a source, but it primarily served to give me an overview in the first place. Because I really wanted to understand every word that was written, I also did a lot of research on the Internet. I'm not going to reproduce or copy anything from the book one-to-one, but rather reproduce my own words.
As a result, I have created a reusable Excel list from the chapters of the book, in which I only have to enter the values from the balance sheet and income statement, and which then calculates the most important key figures for my financial health.
Let's go.
II Equity ratio
Theory
The overview of a company's capital structure provides an initial and, above all, quick insight into how the company finances its assets.
While we have listed all the assets of a company on the assets side of a balance sheet, on the liabilities side we have all the necessary information on where the money for these assets comes from.
The company's capital is basically divided into equity and debt. Equity, which is also known as the book value or equitycomes mainly from the shares issued by the company.
Debt capital can be bank loans or corporate bonds issued.
The more equity a company has, the better it can repay debts, make investments and cover costs.
For us investors, it is therefore desirable to invest in companies with a high equity ratio, i.e. the share of equity in total assets, as this allows us to virtually rule out major liquidity bottlenecks and we know that the company we are looking at can also maneuver better through times of crisis.
Practice
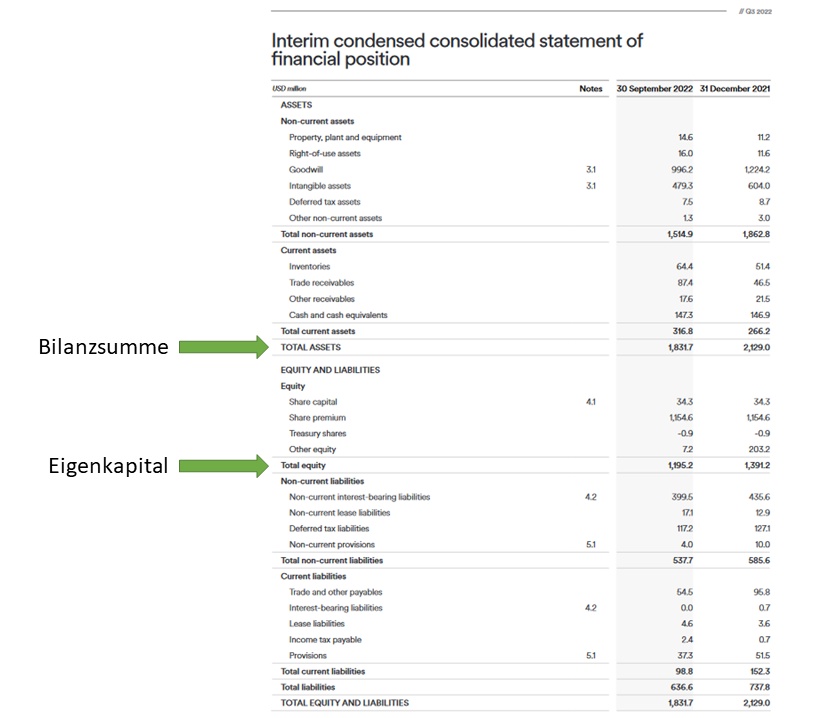
To calculate the equity ratio, we need the values for equity and the balance sheet totalwhich corresponds to the total assets. Figure 1 shows the "Statement of financial position" of AutoStore from Q3/2022, in which the values are marked Total equity for equity and total assets for the balance sheet total/total assets. We insert the values into the formula and calculate AutoStore's equity ratio.
(Equity / total assets) = equity ratio
(1.195,2 / 1.831,7) = 0,65 * 100 = 65%
Opinion
With an equity ratio of 65%, AutoStore is doing quite well. We can see from this ratio that AutoStore can act relatively independently when it comes to investing in the future. We have a reduced risk of insolvency and run less risk of running into over-indebtedness in the near future. However, the analysis of other key figures in the following points shows us that the equity ratio is only an initial assessment based on just two values.
II Gearing
Theory
If the company borrows loans from banks, these are recognized in the balance sheet under interest-bearing liabilities or simply financial liabilities. Liabilities are all obligations of a company towards third parties. So if we have financial liabilities, this is nothing other than Debt. And debt naturally plays a major role when considering financial health. We have already been able to determine the amount of debt indirectly via the equity ratio. Now it is a question of how flexibly the company can pay off its debts. To pay off its debts, the company can first of all fall back on its existing cash holdings. These are all the funds that the company can make available in the short term and are generalized as follows liquid funds called liquid assets. Gearing now seeks to clarify how the company can repay the remaining debt using its equity.
Practice
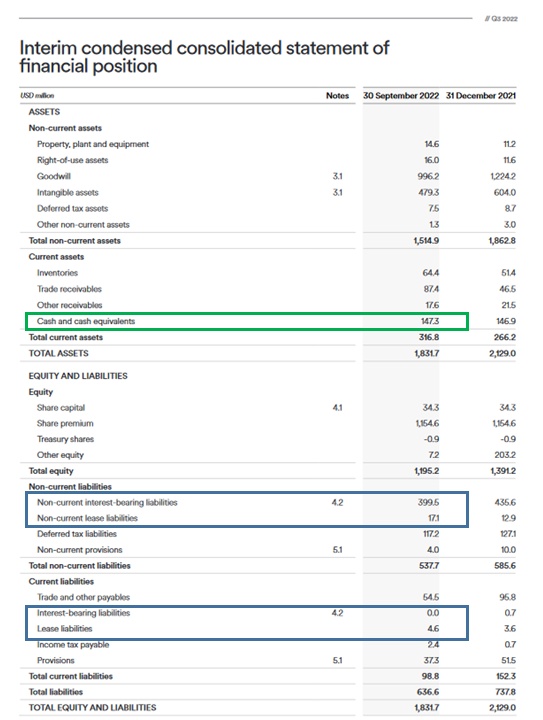
First, we need all the financial liabilities from the balance sheet. Figure 2 has all of these highlighted in blue. In the case of AutoStore, this includes Non-current interest bearing liabilities (non-current interest-bearing liabilities), Non-current lease liabilities (non-current lease liabilities), interest bearing liabilities (current) and lease liabilities (current).
In total, this amounts to USD 421.2 million.
We can now deduct the cash and cash equivalents (cash and cash equivalents). We have already read out the equity in point I.
(Financial liabilities - cash and cash equivalents) / equity = gearing
(421,2 - 147,2) / 1195,2 = 0,2292 * 100 = 22,92%
Opinion
In general, the lower the gearing, the lower the company's debt. According to [1], 10% - 20% is considered ideal. A company would be debt-free if it has more cash and cash equivalents than financial liabilities. With a gearing of 22% and in conjunction with an equity ratio of 65%, AutoStore's level of debt is low up to this point. If the company had to repay its debts in one go tomorrow, it would still be able to operate thanks to its high cash reserves and equity. In my opinion, this is a solid outlook for the coming quarters.
III Dynamic gearing ratio
Theory
Let's imagine that we have to pay off a loan to the bank and do so from our savings in our account. The whole thing would only make sense if, firstly, we are not completely broke afterwards and, secondly, we generate further income so that we can still afford something after paying off all our debts and continue to build up assets.
So what does that mean? Even if a company has low gearing, this key figure should also be compared with the free cash flow of the company.
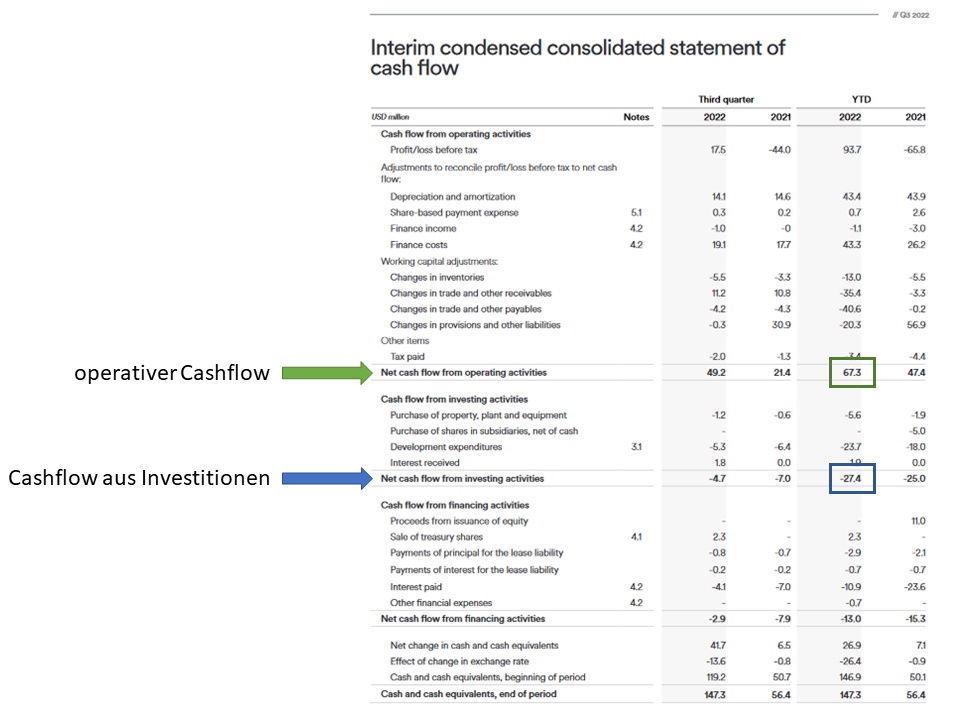
The free cash flow results from the operating cash flow minus the cash flow from investing activitiesboth values that can be read from the income statement. If the free cash flow is positive, the company has generated profits and increased its assets in the period under review. If the free cash flow is negative, the company is making losses.
It is therefore interesting for us investors to find out whether a company can repay its debts solely through the profits it has generated and whether the low level of debt determined by the gearing is confirmed when the cash flow is taken into account.
The result of the following calculation is the duration in years that the company would need if it were to use its entire free cash flow to repay its debt.
The dynamic gearing ratio can also be an indicator for future capital increases. If the profit is constantly positive and can be used to repay debt, a capital increase in equity would become less likely.
Practice
We already know the financial liabilities and cash and cash equivalents, we now need to calculate the free cash flow must now be determined. Sometimes it is listed directly, sometimes it has to be calculated. In the case of AutoStore, we need the Net cash flows from operating activities (operating cash flow) and the Net cash flows from investing activities (cash flow from investing activities) from the income statement in Figure 3, which we subtract from each other.
(Financial liabilities - cash and cash equivalents) / free cash flow = dynamic gearing ratio
(421,2 - 147,2) / 39,9 = 6,86
Opinion
At almost 7 years, AutoStore's dynamic gearing ratio is quite high and, according to Schmidlin, should even be viewed critically. It would take 7 years to pay off the debt while maintaining profits. As a reminder, AutoStore was profitable for the first time in 2022. The decisive factor will be the direction in which this key figure develops. The dynamic gearing ratio is therefore an important key figure for the next quarterly figures and the upcoming annual report to see whether the positive development is confirmed. If profitability and free cash flow increase, the gearing ratio would fall.
IV. Goodwill and amortization
Theory
When it comes to financial stability, we naturally look mainly at the current situation, simply by looking at the figures for the past financial year or quarter. However, there are also indications of the financial health of the company in the future. One of these is the ratio of goodwill to equity.
What was goodwill again? When we buy a company, we hope to achieve synergy effects, true to the motto that we can do more together than alone. However, as these synergy effects cannot be quantified by adding up pure assets, they appear as a special item in the balance sheet - goodwill.
Goodwill is therefore an amount that our company was prepared to pay on top of the actual purchase price of the company that we want to take over.
Goodwill itself is not yet the problem, it could only become a problem if it turns out that the desired synergy effects do not materialize or do not materialize in the hoped-for form. What happens if this is the case? Then the goodwill has to be reduced, i.e. written off, which means that this sudden hole in the cash register has to be financed and from what? That's right, the company's profits, which we as investors definitely don't want.
That's why you often read about a ticking goodwill time bomb, because it simply represents a risk for investors, as profits could be reduced in the future.
Because goodwill itself is not very meaningful as a pure figure, it is set in relation to equity. The question to be answered is to what extent possible amortization is covered by equity. The lower the result here, the better.
Practice
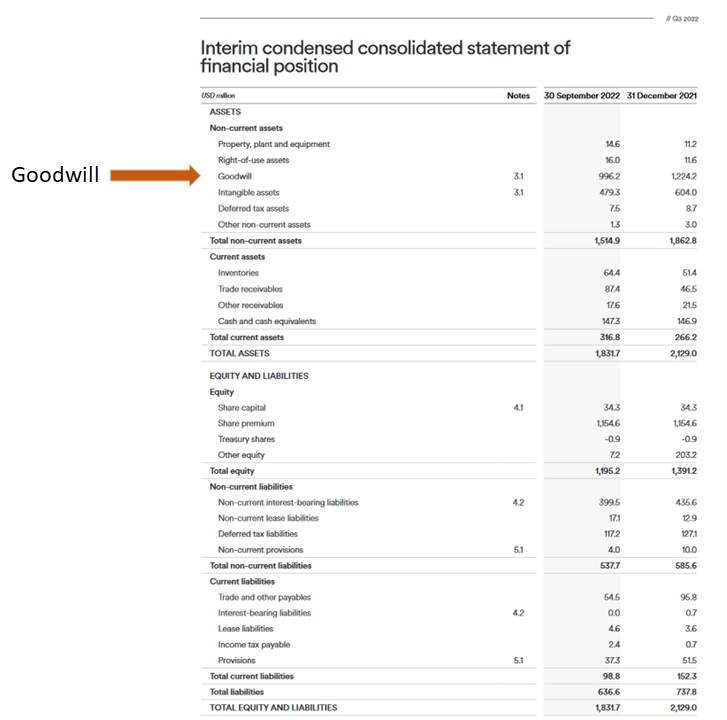
The goodwill is written directly on the balance sheet. We already know the equity.
Goodwill / equity = goodwill share
996,2 / 1.195,2 = 0,8335 * 100 = 83,35%
Opinion
There is no other way to put it than that AutoStore's goodwill ratio is definitely too high and not healthy. The company can only get down from 83% if it writes off goodwill or increases its equity, for example by issuing new shares. Both would be clearly negative from a shareholder perspective.
Conclusion - AutoStore's financial health
Looking at the current situation, or more precisely the situation in Q3/2022, AutoStore is in a good position at first glance. The equity ratio gives the company enough leeway to pay off debt and invest in the future, but the gearing in connection with the dynamic debt ratio already makes us realize that we will need to take a closer look at these figures in the future. The goodwill share is too high and in order to maintain my personal risk/return ratio, as much as I like the product, AutoStore cannot go beyond a small position in my portfolio.
On February 16, we'll have the figures for Q4 and thus for the whole of 2022. Thanks to our analysis of the balance sheet and cash flow, we now know what to look out for, can draw a curve and use it to make an investment decision.
So it remains exciting.
Finally, I would like to know from anyone who knows more than I do whether you would come to the same conclusion based on the figures mentioned.
Thank you for reading ❤
Sources:
[1] Book: Company presentation and key figure analysis - Nicolas Schmidlin. ISBN: 978-3800645640
#bilanzen
#guv
#financials
#verschuldung
#aktienanalyse


