Share presentation Wacker Chemie
On February 22, a study was published by the US investment bank Morgan Stanley, which took a close look at the Wacker Chemie share. Wacker Chemie is considered one of the world's largest manufacturers of high-purity polysilicon, the basic raw material in semiconductors or even solar cells. In Europe they are the only manufacturer, in the USA there is only one other competitor: Hemlock Semiconductor.
Now, both in the USA and in Europe, there are two programs worth billions of euros, which invest in domestic clean and CO2-neutral industries and thus want to increase competitiveness, and from which Wacker Chemie could profit: One is the American Inflation Reaction Act (IRA) and the European Green Deal Industrial Plan.
Measures of support could be, for example, tax breaks and / or guaranteed energy purchase prices. According to Morgan Stanley, this could cause the share price to rise to EUR 185; in the best case, even a doubling to around EUR 300 is possible.
However, risks should not be concealed: firstly, nothing has been decided politically, China could flood the market with cheap polysilicon, and Wacker also has a 31% stake in its spin-off company Siltronic, and if this were to run into difficulties, Wacker could slide along with it.
I already had 23 Wacker shares in my portfolio since 2021, up 12% despite the crises of the past few years., I had explained the thoughts on the purchase at that time in a Blogartikel explained. The dividend yield at the current price is 5.39% (last 8 EUR in 2022), and with a payout ratio of 30.6%, there is still good room for dividend increases. Yesterday, as mentioned above, I added 7 shares.
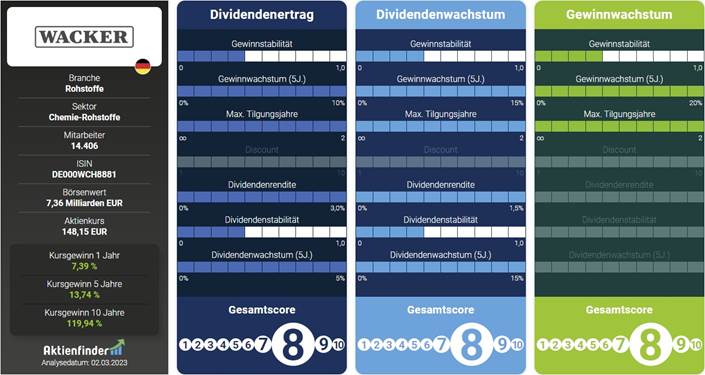
Image Akienfinder Scorecard
Wacker Chemie also looks solid on the Stock Finder Scorecard.
According to Scalable Capital, 73% of analysts recommend Wacker as a buy, 20% advise hold, and 7% recommend sell.
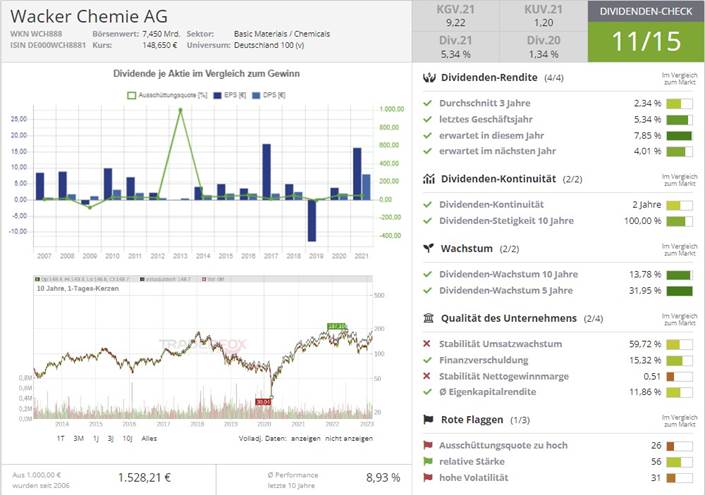
The dividend check in Trader Fox's Stock Finder also ends in the green with 11 out of a possible 15 points.
Image Traderfox Stock Terminal
Freddy's freaky chart of the week: Wacker Chemie
After Wacker Chemie was set to "Buy" by some analysts, the question arises: Does the share have potential from a chart perspective?
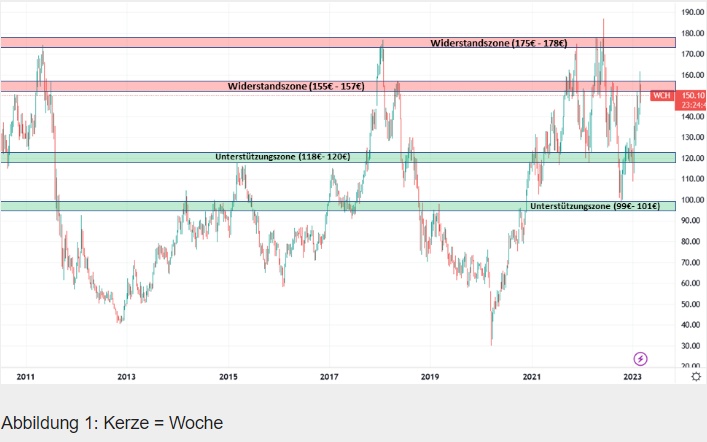
If we first look at the weekly view, i.e. where one candle reflects a whole week, we do not see a long-term solid uptrend. In my view, the chart has been characterized by volatility and some more extreme highs and lows over the years. The current resistance zone runs between EUR 155 and EUR 157. It was broken only briefly, but not sustainably. A support zone lies between 118 EUR and 120 EUR. If this is breached again, the next one would be at around EUR 100.
Figure 1: Candle = week
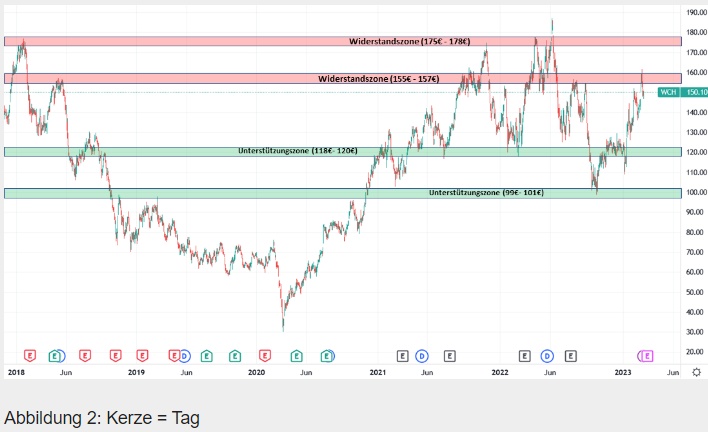
In the daily view, we can once again see the support zone between 118 EUR and 120 EUR. It has already been breached once, but it held several times before.
Figure 2: Candle = Day
Let's now look again at the MACD as well as RSI and the SMA 50 & 200.
In the case of the MACD, the MACD line recently crossed the signal line (orange line) from top to bottom. However, the crossing is not yet sustainably confirmed. Even though we are in a short-term uptrend, the MACD does not yet provide clear signals.
Figure 3: Indicators MACD, RSI and SMA 50 & 200 / daily view
The RSI is coming out of the "overbought" zone. If we look at the value (here about 57), we assume an upward trend. This also fits the current picture. Nevertheless, the RSI is in a slight fall, which increases the risk of a trend reversal.
If we take a look at the two different SMA's last, the SMA 50 in particular has an additional supportive effect. Also, the long-term 200 SMA seems to make a bend upwards again.
The trend is to be classified as "stronger".
Conclusion:
Wacker Chemie has experienced major fluctuations in recent years. Current momentum is in the uptrend. If the share manages to break above EUR 157, it could head back towards an all-time high. The next earnings in mid-March will definitely be exciting and a signpost in which direction it could go.
About the author of the chart analysis:
This chart analysis was created by Frederic from Optioncamp. He is passionate about the stock market and has been trading options for quite some time.
Data status 02.03.1023
This stock introduction is from my free weekly update:
Contents:
10 European stocks with high dividend yields (withholding tax easy)!
Stock idea of the week: Wacker Chemie with chart analysis
- Gas supply of the West from Russia
- When 20% of costs are spent on bureaucracy
- EFT-Guide part 2 now available!
- Travelogue Colombia (Cartagena for the second time)
- My securities sales of the week and new savings plans
- A dividend trip through Europe
- An interesting candlestick formation: The hammer signal presented
- Stock idea of the week with chart analysis: Wacker Chemie
And much more!