2J·

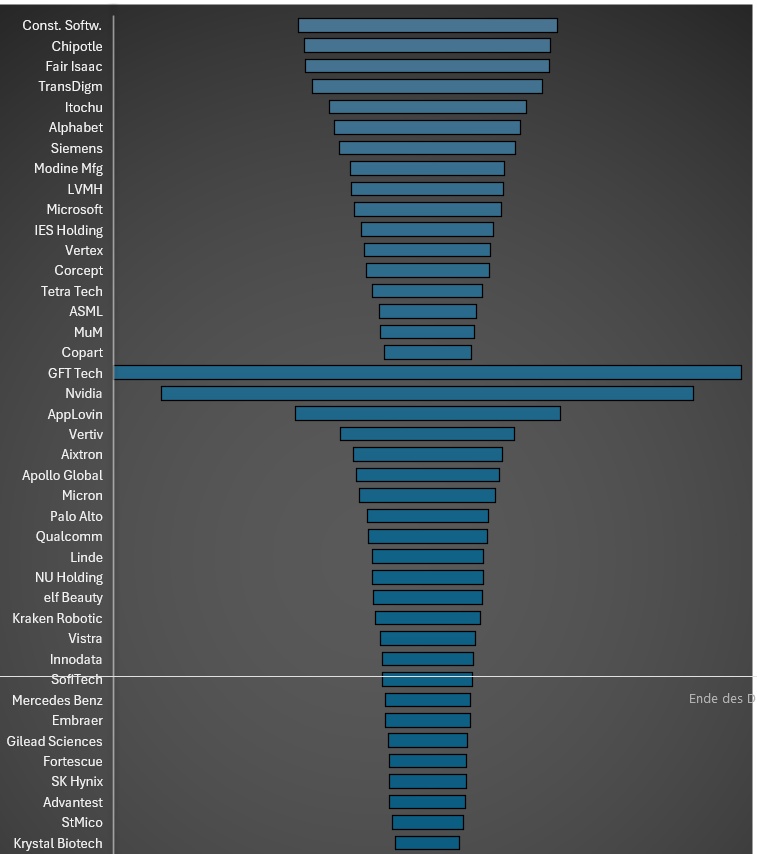
Funnel diagram of my securities account

Hello my dears,

Today I'd like to give you a brief analysis of my portfolio in funnel form.


The upper funnel represents the core and the lower funnel the satellites.


What is striking here is the high cluster risk in Nvidia $NVDA (+4,25 %) and GFT technology $GFT (-0,45 %)

However, as I am still convinced of the two stocks, I am sticking with the large position. Nvidia is one of the largest positions in many ETFs, so I would almost include it in the core.


In the crypto area, I am still 0.89% in Defi Tech $DEFI (-3,57 %) and0.88% in Bitcoin $BITC (-2,22 %) which I will increase. Unfortunately, these positions were cut off at the bottom of the funnel.


I look forward to opinions and comments.
attachment
12
7 Commentaires

image de profil
Where can you create this?
image de profil
@JuppDupp Hello my dear, I have created via Exel. I personally find it quite clear to quickly determine an overweighting
1
image de profil
@Tenbagger2024 * forehead slaps* yeah, right.
1
GF Technolgies so highly weighted? Why? ... Yes, the average price target is somewhere around +60%, but currently all technical indicators are Sell - and deep red at that... What prompted you to do this?
image de profil
@PIXELINVESTOR
Thank you for the legitimate question. The position in GFT has become so large. Of course I could take profits here, and according to the chart it could go even lower. Fundamentally, profits are growing by 16% this year and by 11% next year, so the P/E ratio is down to a historic low of 9.9. That means the share is historically cheap, and in terms of products, the company is moving into new areas and incorporating AI here. In addition, the dividend yield is 3%.
image de profil
Le commentaire a été supprimé
image de profil
Thank you, my dear, for your good description. Palantir's rating is also slowly entering a critical range. I am less critical of Broadcom and Comfort System. I count Comfort as a long-term stock
Participez à la conversation