
Guidance for the latter half of the year shows a significant expectation for margin contraction compared to Q2'25 performance. While Q3'25 revenue growth (17%) met expectations, the Q4'25 operating margin forecast dropped to 23.9%
Discussion sur NFLX
Postes
276
2J·
Netflix Q3 2025 Earnings: Record Viewership and Advertising Revenue Amid Brazilian Tax Impact
$NFLX (-1,61 %) reported strong financial results for the third quarter of 2025, achieving record viewership and advertising sales despite a significant one-time tax expense related to a dispute with Brazilian tax authorities that impacted earnings per share (EPS) and operating margin.
Financial Highlights and Impact of Brazilian Tax Expense
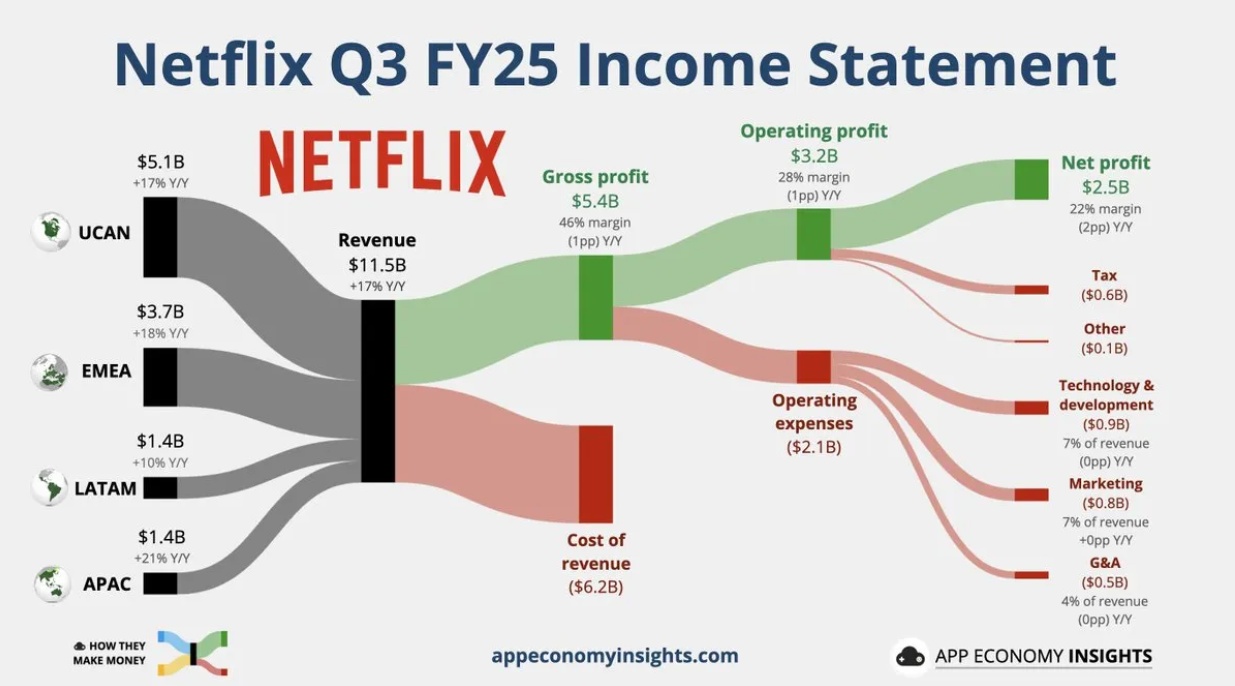
In Q3 2025, Netflix's revenue rose 17% year-over-year to $11.51 billion, meeting analyst expectations. However, adjusted EPS came in at $5.87, below the expected $6.97, primarily due to a $619 million tax-related expense in Brazil, which was not anticipated in forecasts. The net income reported was $2.55 billion, also missing the higher estimates of $3 billion.
The company's operating margin was 28%, underperforming the 31.5% guidance, wholly attributable to the aforementioned Brazilian tax issue. Netflix management clarified the tax is not unique to the company nor exclusive to streaming services and indicated that absent this expense, operating results would have exceeded expectations. They also noted no significant future impact is expected from this tax dispute.
Record Engagement and Viewer Share
Despite the financial headwind, Netflix achieved record television viewer shares in major markets. In the United States, Netflix captured an 8.6% viewer share, and in the United Kingdom, 9.4%, marking the highest levels since its streaming inception. These figures represent increases of 15% and 22%, respectively, from the fourth quarter of 2022.
This surge in viewership was fueled by successful original content such as "Squid Game" Season 2, which saw over 7 billion minutes viewed in September alone, making it a historic Netflix title. Additionally, the animated film "K-Pop Demon Hunters" set a platform record for viewership, further boosting engagement metrics.
Advertising Revenue Milestone
The quarter marked the best-ever performance for Netflix's advertising business. Upfront commitments for advertising in the U.S. doubled, and the ad-supported subscription tier grew to 94 million monthly users as of May 2025. The company is on track to more than double its ad revenue in 2025 from a relatively low base.
Netflix's expansion and enhancement of its internal advertising technology platform have improved inventory control and targeting capabilities, leading to higher profitability in this segment and greater advertiser interest.
Geographic Revenue Breakdown and Monetization Strategy
Revenue growth was broad-based across regions: U.S. & Canada contributed $5.07 billion (+17%), Europe, Middle East & Africa $3.7 billion (+18%), Latin America $1.37 billion (+10%), and Asia-Pacific $1.37 billion (+21%).
Since early 2023, Netflix has pivoted its strategy away from emphasizing subscriber counts, choosing instead to prioritize revenue, margin expansion, and user engagement.
The crackdown on password sharing led to approximately 50 million new paying accounts, many opting for the ad-supported tier, underpinning both revenue and engagement growth.
2025 Outlook and Strategic Investments
For Q4 2025, Netflix forecasts revenue of $11.96 billion, reflecting 16.7% annual growth, and EPS of $5.45. The operating margin is expected to be 23.9% due to timing of content investments and marketing costs. Full-year 2025 revenue guidance stands at $45.1 billion with a 29% operating margin, slightly below prior expectations due to the Brazilian tax issue.
Netflix continues to invest heavily in new areas. Its live event strategy includes broadcasting boxing matches such as "Jake Paul vs Mike Tyson" , which attracted over 108 million global viewers in 2024, and exclusive NFL Christmas Day games through a multi-year deal starting in 2025.
In gaming, Netflix has invested about $1 billion, offering over 120 mobile games including titles like "GTA: San Andreas" and proprietary IP-based games. While currently games contribute less than 0.5% to total user engagement time, Netflix is betting on this category for future growth.
Market Reaction and Long-Term Prospects
Netflix shares declined 5-6% in after-hours trading following the earnings release, reflecting investor disappointment over the EPS miss primarily driven by the Brazilian tax issue. Despite this short-term negative reaction, industry analysts remain optimistic about Netflix's long-term trends, citing strong content leadership, user engagement, and robust ad revenue growth as key drivers.
Netflix has decisively shifted from growth primarily measured by subscriber additions to a balanced focus on monetization, profitability, and diversified content offerings. This strategy includes leveraging artificial intelligence for content discovery and expanding into live programming and gaming to sustain future momentum.
In summary, Q3 2025 demonstrated Netflix's capability to break records in engagement and advertising revenue, setting a solid foundation for continued growth even amid regulatory and geographic challenges. The company's focus on profitability and innovation positions it well for the evolving streaming entertainment landscape.
Sources:
https://quartr.com/companies/netflix-inc_3477
22

3J·
Netflix Q3’25 Earnings Highlights
🔹 Revenue: $11.51B (Est. $11.52B) 🔴; UP +17% YoY
🔹 EPS: $5.87 (Est. $6.94) 🔴; UP +9% YoY
🔹 Free Cash Flow: $2.66B; UP +21% YoY
Q4’25 Guidance
🔹 Revenue: $11.96B (Est. $11.90B) 🟢
🔹 EPS: $5.45 (Est. $5.42) 🟢
🔹 Operating Income: $2.86B (Est. $2.88B) 🔴
🔹 Operating Margin: 23.9% (Est. 24.1%) 🔴
FY25 Guidance
🔹 Revenue: $45.1B; from $44.8B–$45.2B
🔹 Operating Margin: 29%; from ~30% (reported) / 29.5% (F/X basis)
🔹 Free Cash Flow: ~$9B; from $8.0B–$8.5B
Q3 Segment Revenue (YoY)
🔹 U.S. & Canada (UCAN): $5.07B; UP +17% YoY
🔹 EMEA: $3.70B; UP +18% YoY
🔹 Latin America: $1.37B; UP +10% YoY
🔹 APAC: $1.37B; UP +21% YoY
Other Key Q3 Metrics
🔹 Operating Income: $3.25B; UP +12% YoY
🔹 Operating Margin: 28.2%; DOWN -1.8 ppts YoY
🔹 Operating Cash Flow: $2.83B; UP +22% YoY
🔹 Share Repurchases: $1.9B; Authorization Remaining $10.1B
🔹 Cash & Equivalents: $9.3B; Gross Debt: $14.5B
Commentary
🔸 “Operating margin was below guidance due to an expense related to an ongoing dispute with Brazilian tax authorities; absent this, we would have exceeded our Q3’25 operating margin forecast.”
🔸 “We recorded our best ad sales quarter ever and are on track to more than double ads revenue in 2025.”
🔸 “We’re finishing the year with good momentum and an exciting Q4 slate, including the final season of Stranger Things and multiple live events.”
66
3J·
Crisis favorites: Smoke signals & lipstick - Psychology of consumption
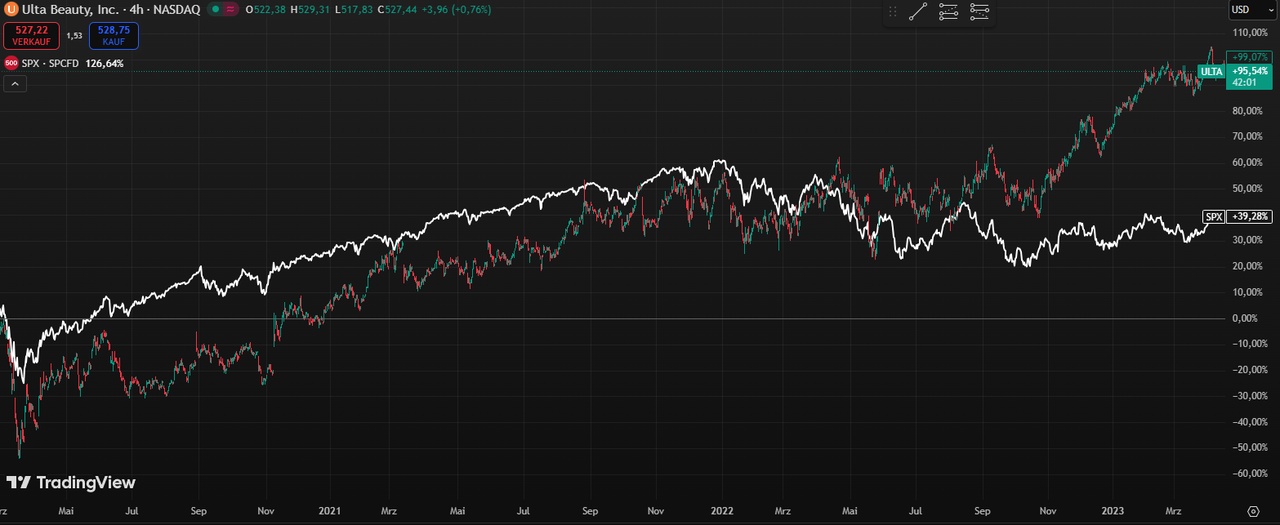
The so-called lipstick effect describes the phenomenon that consumers do not completely forego luxury during recessions, but buy smaller luxury items when large purchases are no longer available.
(The chart below compares the performance of ULTA Beauty and the S&P 500 since March 13, 2020, when the nationwide COVID-19 lockdowns began).
(https://de.tradingview.com/chart/Wl3dkBka)
The term was coined by Juliet Schor back in 1998.
"They are looking for affordable luxury, the thrill of buying in an expensive department store, indulging in a fantasy of beauty and sexiness, buying 'hope in a bottle. Cosmetics are an escape from an otherwise drab everyday existence".
He gained notoriety when Estée Lauder boss Leonard Lauder realized after the 2001 attacks that his company was selling an unusually high number of lipsticks.
Without further ado, Lauder considered lipstick to be a counter-indicator to the economic situation.
Today, the effect is widely extended to consumer goods beyond cosmetics:
Small goods instead of expensive prestige items gain in popularity during crises.
1.
What is the lipstick effect?
In essence, the lipstick effect means
When budgets shrink, consumers cut back on expensive purchases - but indulge in a little sin.
"Consumers will still tend to buy small luxury items even during an economic downturn".
Or:
If you can't afford a car, you might buy the new luxury lipstick instead of nothing at all.
(https://fastercapital.com/startup-topic/People-Will-Actually-Buy.html)
After 9/11, the demand for lipstick shot up by around 11%.
Later, during the 2008 financial crisis $EL (+1,99 %) again reported rising cosmetics revenues, while other sectors suffered.
The lipstick effect is not constant; extreme situations such as deep snow or store closures due to the pandemic can weaken it.
However, in normal downturns, studies show that it works quite reliably as a consumption indicator.
2.
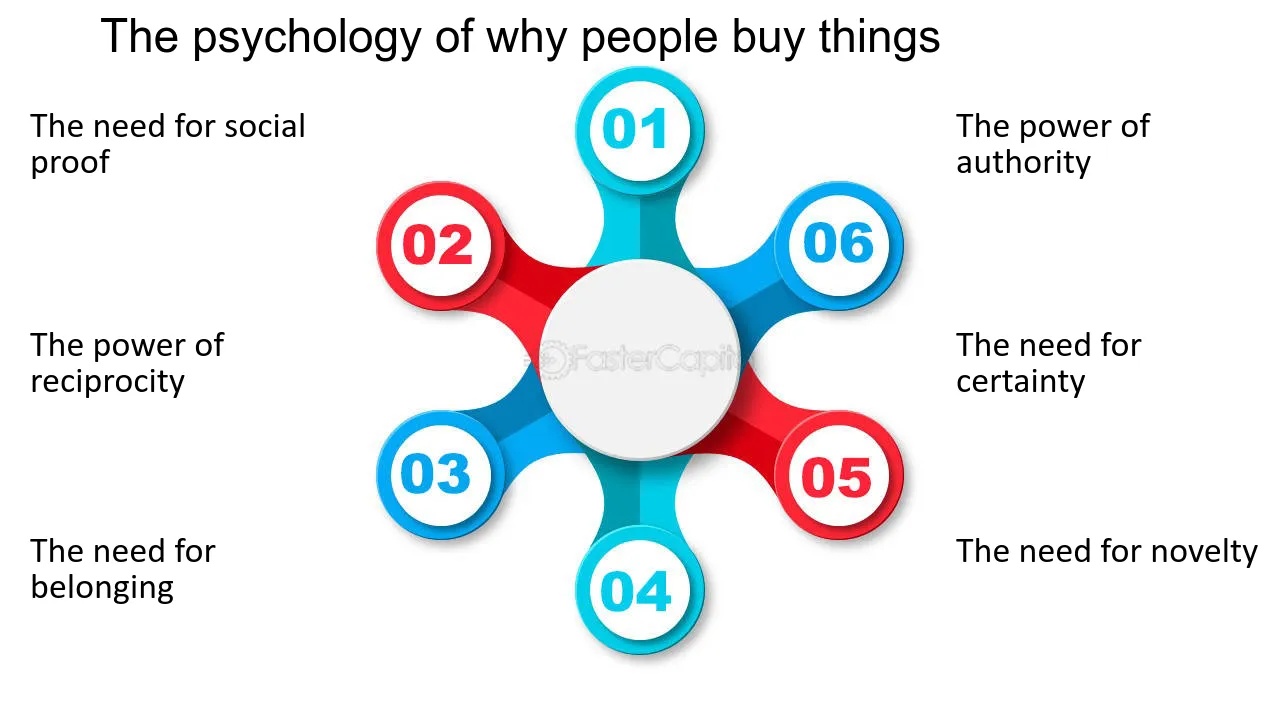
Psychological drivers
(https://www.falstaff.com/de/news/im-rausch-der-hormone)
Why do people reach for chocolate rather than expensive theater tickets in uncertain times?
Psychology is behind the lipstick effect.
Even when money is tight, people want to treat themselves to something good - a sweet consolation or a new make-up.
Consuming lipstick or ice cream can lift your mood and give you the feeling that you are doing something positive.
In a recession, women show an increased interest in beauty and attractiveness products, especially when they feel a high motivation to increase their attractiveness or to attract a partner.
This supports the lipstick effect hypothesis:
Even in times of crisis, people do not forgo small luxury items - especially those that boost self-esteem or attractiveness.
The study explains this in terms of evolutionary psychology:
- In uncertain times, perceived financial security decreases.
- People (especially women in this study) therefore invest more in their appearance to send signals of attractiveness that potentially symbolize access to stable social and economic resources.
3.
Economic impact: Crisis-winning industries
In many downturns, certain sectors have benefited disproportionately. Traditionally, cosmetics providers have flourished - lipstick, mascara etc. are seen as an "affordable luxury".
For example $OR (-0,56 %) reported increases in sales and profits for the crisis year 2008 despite the global contraction.
This effect explains why cosmetics shares are often considered stable. Tobacco and alcohol companies are also often robust:
Habitual goods such as cigarettes or beer are considered "addictive" goods - even in bad times, demand remains relatively stable. (Historically, cigarettes were even used as a means of bartering for war).
Fast food chains such as McDonald's do well because people want cheap food when everything is more expensive.
Gambling providers can also boom when dreams become more important than sober calculation.
Streaming services/online entertainment are typical: while physical contact is declining, the need for internet entertainment is increasing (Netflix, for example, grew strongly during coronavirus). Investopedia specifically names "fast-casual restaurants and multiplex cinemas" as winners of the crisis.
- Cosmetics
($OR (-0,56 %)
, $EL (+1,99 %))
Sales continue to rise in 2008 despite the crisis. The global cosmetics market amounted to around USD 504 billion in 2022 (growth +15% compared to 2021) - a sign of the continued importance of beauty care.
- Tobacco/alcohol
($BATS (-0,17 %), $PM (+0,09 %), $MO (+0,05 %), $DGE (-0,71 %))
Habitual drinkers and smokers rarely cut back further, tend to consume the same thing or switch to cheaper brands. Tobacco, for example, was an expensive means of exchange during the war.
- Fast food & entertainment
($MCD (-0,54 %), $NFLX (-1,61 %), $AMC (-0,85 %)
)
Affordable indulgences and distractions are in demand. Reports from the corona crisis document, for example, that Amazon recorded a +70% jump in e-commerce sales in the beauty and care sector during the lockdown compared to pre-crisis levels - an indication that consumers were busy ordering small luxury items online.
4.
Historical examples of crises
Concrete history makes the effect tangible: Already after 9/11 in 2001 $EL (+1,99 %) reported unusually high lipstick sales - Leonard Lauder even spoke of a "counter-indicator" to the recession.
The picture continued in 2008/09:$OR (-0,56 %) and other cosmetics companies fared better than the market as a whole (they were able to expand their sales), while luxury goods shrank.
Corona pandemic (2020) again brought examples: Although the economy slumped in the first half of the year, online trade in beauty products boomed,
Amazon recorded a +70% increase in beauty/care products in e-commerce in spring 2020 compared to the pre-crisis period and Sephora ($MC (-1,81 %)) reported a +30 % increase in online sales compared to 2019.
The effect was even evident in 2022/23: according to market researchers, around a third of make-up customers in the UK bought products as a "reward", with spending on lipstick there increasing by around 12.3% in 2023 (despite the tight cost of living).
In China, the lipstick effect was conspicuously absent in 2022, as a study by the China Institute made clear. (https://cidw.de)
"Despite government efforts to promote moviegoing with subsidies and discounts, consumers remain cautious, especially in tier 1 cities. The "lipstick effect", according to which small expenditures increase in times of crisis, did not materialize in China. In December, the China Film Administration launched a subsidy program."
5.
Stock markets in times of crisis
How did investors react to the lipstick effect? Some consumer stocks are considered defensive securities. Thus $OR (-0,56 %) 2008 continued to show a profit - a prime example of stability. Estée Lauder experienced a small price jump in 2001 as investors bet on the strong demand for beauty products.
Tobacco stocks ($BATS (-0,17 %) , $MO (+0,05 %), $PM (+0,09 %)) and food companies ($NESN (-0,97 %) ) were also regarded as pullback stocks:
Their cash flows suffer comparatively little as underlying demand continues.
McDonald's ($MCD (-0,54 %)) was largely able to compensate for its 2008 share price slump by 2010, and the share price also recovered quickly after the coronavirus slump in 2020.
Netflix ($NFLX (-1,61 %)): Its price briefly doubled with the lockdown dividend, after which the situation normalized.
6.
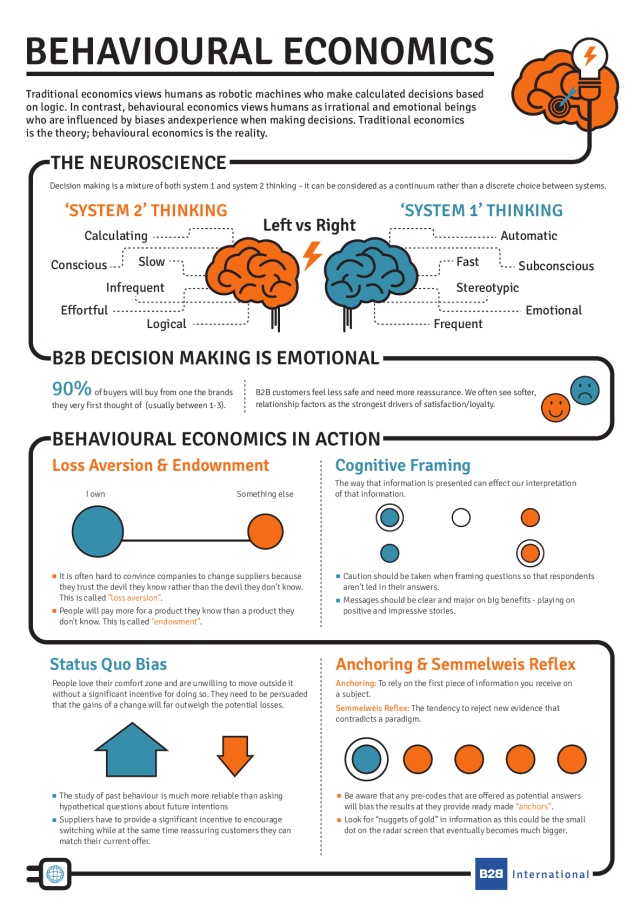
Behavioral economic classification
The lipstick effect fits well into the picture of loss aversion and prospect theory: investors and consumers avoid large losses (e.g. cash tied up in a car) and value small gains relatively highly.
(https://hub.hslu.ch/business-psychology/prospect-theory)
In this sense, an inexpensive luxury item minimizes the feeling of "having done without".
Social influences also have an effect: If you see friends treating themselves to something despite the crisis, you are more likely to justify it for yourself.
Behavioral economics thus explains why people satisfy their unpaid desire for a little happiness during a crisis - often reflexively, emotionally and depending on the context.
(https://www.b2binternational.com/publications/what-is-behavioural-economics)
In both world wars, cigarettes were more a part of survival than chocolate - as a tranquillizer in the trenches and a tangible bartering commodity.
Hitler had smoking banned in many places during the Second World War, but tobacco was still available at the front. Chocolate became scarce in 1939: US soldiers were served sweets in their rations, officially to boost morale. Other goods such as coffee, ice cream and video games have similar stories - in the USA, for example, the chocolate business boomed briefly after the world wars as a nostalgic feel-good store.
What was good as a small consolation in war is considered a luxury in peace.
Sources:
https://www.sueddeutsche.de/panorama/lippenstift-mode-geschichte-1.5360041
https://fastercapital.com/startup-topic/People-Will-Actually-Buy.html
https://fastercapital.com/content/The-Lipstick-Effect-and-its-impact-on-consumer-behavior.html
https://pmc.ncbi.nlm.nih.gov/articles/PMC9636953/#:~:text=consumers%20to%20spend%20more%20on,1

+ 4
1313
2 Commentaires
Felix@Shareholder
12H
•
11
•Afficher la réponse


5J·
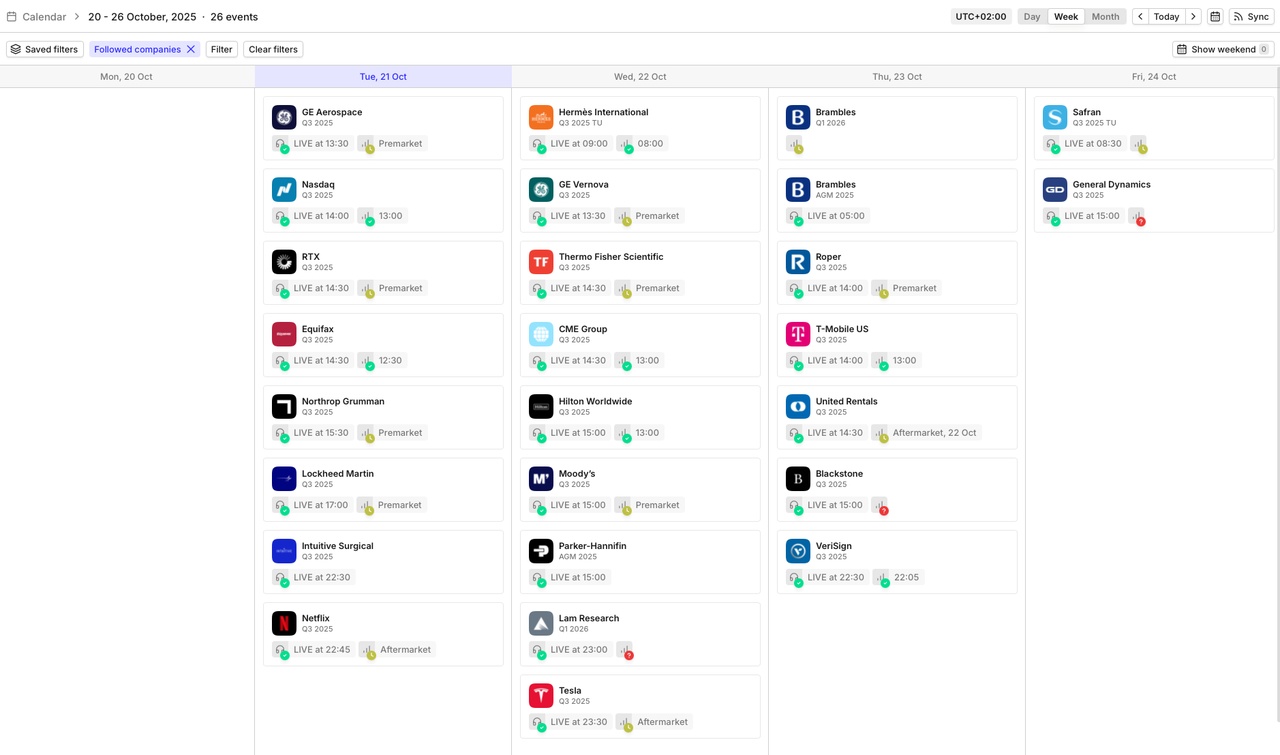
Quartalsberichte 21.10-24.10.25
$NDAQ (-0,14 %)
$RTX (+0,1 %)
$KO (-0,37 %)
$MMM (-1,74 %)
$NOC (-0,1 %)
$LMTB34
$OR (-0,56 %)
$TXN (-1,56 %)
$NFLX (-1,61 %)
$HEIA (-2,16 %)
$SAAB B (+5,28 %)
$UCG (-2 %)
$BARC (+0,23 %)
$GEV (-1,56 %)
$TMO (+0,74 %)
$T (+2,17 %)
$MCO (+2,02 %)
$IBM (+8,06 %)
$SAP (-3,22 %)
$TSLA (-3,07 %)
$AAL (+8,03 %)
$FCX (+0,06 %)
$HON (-2,23 %)
$DOW (+1,43 %)
$NOKIA (+1,13 %)
$TMUS (-1,05 %)
$INTC (-7,3 %)
$NEM (-4,95 %)
$F (+6,36 %)
$PG (-0,4 %)
$GD (+2,31 %)

33

1Sem.·
My review for September 2025: facts, figures and data - honest and unembellished
September was the month in which my account shone like the last rays of summer sunshine! Why? The half-year bonus catapulted this month into the month with the highest income of all time. Of course, the money doesn't go into savings, but is put into the market the following month, because share price growth and dividends beat any consumption. There was also an unexpected refund from the dental supplement, which has already been reinvested. Who says that prophylaxis doesn't bring returns after all?
And what else? Business as usual: preparations for ice swimming started at the end of the month thanks to colder temperatures, daily sport and exercise, a nice community meeting of frugalists and investors. Yes, we talked about dividends rather than the latest fashion. Everything was rounded off with a donation. My portfolios went sideways, but did what they are supposed to do: Generate cash flow. And from this month onwards, there will be additional risk figures presented. A little growth and distribution. Time for a review!
Overall performance
This month was a typical month of consolidation for me. My investments moved sideways with only a very slight increase. Is this a good sign for a year-end rally? There was also an initial cut in the Fed's key interest rate. However, there were no major movements, and Q4 is more likely to be responsible for this. As always, income rained down on the account. My key performance indicators for my overall portfolio at a glance:
- TTWROR (month under review): +1,76 % (previous month: +1.01 %)
- TTWROR (since inception): +76,55 %
- IZF (month under review): +9,64 % (previous month: +12.50 %)
- IZF (since inception): +11,15 %
- Delta: +€615.12
- Absolute change: +€2,635.52
Performance & volume
The rise in the price of $AVGO (+1,78 %) allows my largest single share position to grow further and strengthens its dominance. And the class leader has not spilled the beans in terms of performance since purchase either: +337%! After the $BAC (+1,46 %) climbed into the top 5 by volume in the previous month, it remains in this group. The banks are currently doing well. Also$WMT (-0,64 %) The retail giant is a reliable dividend payer and an important pillar among my individual stocks. The competitor$TGT (-0,47 %) on the other hand, is the red lantern in my portfolio. Despite thefts and sales problems, I see a healthy business model. I am sure that this share will bounce back and continue to invest on a monthly basis.
Size of individual share positions by volume in the overall portfolio:
Share (%) of total portfolio and associated portfolio:
$AVGO (+1,78 %) 3.30 % (main share portfolio)
$NFLX (-1,61 %) 1.87 % (main share portfolio)
$WMT (-0,64 %) 1.74 % (main share portfolio)
$FAST (+0,41 %) 1.72 % (main share portfolio)
$BAC (+1,46 %) 1.49 % (main share portfolio)
Smallest individual share positions by volume in the overall portfolio:
Share (%) of the total portfolio and associated securities account:
$SHEL (-0,11 %) : 0.41 % (crypto follow-up portfolio)
$NOVO B (+0,13 %) 0.50 % (main share portfolio)
$TGT (-0,47 %) 0.55 % (crypto follow-on deposit)
$HSBA (+0,87 %) 0.58 % (main share portfolio)
$GIS (-1,44 %) 0.60 % (main share portfolio)
Top-performing individual stocks
Shares with performance since initial purchase (%) and the respective portfolio:
$AVGO (+1,78 %) a: +337 % (main share portfolio)
$NFLX (-1,61 %) : +153 % (main share portfolio)
$WMT (-0,64 %) : +78 % (main share portfolio)
$FAST (+0,41 %) +76 % (main share portfolio)
$SAP (-3,22 %) +75 % (main share portfolio)
Flop performer individual stocks
Shares with performance since initial purchase (%) and the respective portfolio:
$TGT (-0,47 %) : -38 % (main share portfolio)
$GIS (-1,44 %) -31 % (main share portfolio)
$NKE (-0,74 %) -27 % (main share portfolio)
$CPB (-0,86 %) -24 % (main share portfolio)
$UPS (+0,01 %) -24 % (main share portfolio)
Asset allocation
My asset allocation is as follows:
ETFs: 39.1%
Equities: 58.6%
Crypto: 2.2 %
P2P: less than 0.01 %
Investments and subsequent purchases
I have invested the following amounts in savings plans:
Planned savings plan amount from the fixed net salary: € 1,030
Planned savings plan amount from the fixed net salary, incl. reinvested dividends according to plan size: € 1,140
Savings ratio of the savings plans to the fixed net salary: 49.75
In addition, the following additional investments were made from returns, refunds, cashback, etc. as one-off savings plans/repurchases:
Subsequent purchases/one-off savings plans as cashback annuities from refunds: € 73.00
Subsequent purchases/non-recurring savings plans as cashback annuities from bonuses/incentives from the KK: € 0.00
Subsequent purchases from other surpluses: € 31.00
Automatically reinvested dividends by the broker: € 5.03 (function is only activated for an old custody account, as I otherwise prefer to control the reinvestment myself)
Additional purchases were made:
Number of additional purchases: 2
73.00 € for $TDIV (+0,07 %)
25.00 € for $ZPRG (+0,36 %)
Passive income from dividends
My income from dividends amounted to € 139.14 (€ 128.42 in the same month of the previous year). This corresponds to a change of -1.36% compared to the same month last year. The slight decrease is due to the fact that my large Vanguard ETFs postponed the distribution to the following month. The following are further key data on the distributions:
Number of dividend payments: 34
Number of payment days: 17 days
Average dividend per payment: € 4.09
average dividend per payment day: € 8.18
The top three payers are:
My passive income from dividends (and some interest) mathematically covered 16.05% of my expenses in the month under review.
Crypto performance
My crypto portfolio ran sideways in September with highs and lows. The hope here lies more in the coming Q4. My key figures:
Performance in the reporting period: +8.66 %
Performance since inception: +135.10
Share of holdings for which the tax holding period has expired: 98.57 %.
Crypto share of the total portfolio: 2.20 %
I am vigilant with regard to crypto. The exit should continue. I don't want to provide the exit liquidity for the other market participants. There will be news in the following month.
Performance comparison: portfolio vs. benchmarks
A comparison of my portfolio with two important ETFs shows:
TTWROR (current month): +1,76 %
$VWRL (+0,41 %) : +2,63 %
$VUSA (+0,65 %) : +2,56 %
One possible explanation for the poorer performance compared to the index values could be a higher proportion of individual shares,
New: Risk indicators
Here are my key risk figures for the month under review (and in brackets YTD)
Maximum drawdown: 0.94% (17.17%)
Maximum drawdown duration: 19+ days (231+ days)
Volatility: 1.68% (11.51%)
Sharpe Ratio: 5.73 (0.29)
Semi-volatility: 1.21% (9.04%)
An extremely low drawdown of only 0.94% shows that your portfolio had hardly any fluctuations during the month. This is typical for a sideways phase or stable markets.
The YTD drawdown of 17.17% is no coincidence: Trump's tariffs have mainly affected consumer-related stocks such as $TGT (-0,47 %) have been hit. However, my focus on stable dividend payers and broad-based ETFs has limited the losses. The fact is, however, that Trump has put a dent in my figures.
Outlook
As you can see from the introduction, there were no highlights, but there were also no disasters for me to report on. So we're done for this month. Thanks for reading!
However, I still have some questions for you to improve my review:
Are you also interested in the performance and top/flop5 of my ETFs or cryptos? Then let me know in the comments and I'll include it in the coming months.
In my posts on Instagram and also here, I keep talking about my cashback pension. Would you like to know more about the concept, what's behind it for me and how it will supplement my "share and ETF pension"?
My review here on getquin includes additional key figures as well as those from my Instagram reviews. Would you also like to see more from the budget review of my private finances included here as a little extra?
👉 Would you like to view my review as an Instagram Carousel post?
Then follow me on Instagram:
📲 There's also 3 posts a week in addition to the portfolio and budget review: @frugalfreisein
Please pay close attention to the spelling, unfortunately there are too many fake and phishing accounts on social media. I have also been "copied" several times now.
👉 How was your month in the portfolio? Do you have any tops and flops to report?
Leave your thoughts in the comments!
1717

2Sem.·
My biggest mistakes so far
Reading time: 10 minutes
Mistakes are to the stock market as volatility is to the chart. Looking back, they are what hurts the most - but also teaches the most. In recent years, I have deliberately tried out many strategies in order to develop my own system. There have been some hits - but also misses, which have shown me what really counts in the long term.
This article is primarily aimed at new investors. I hope to save you from making one or two costly mistakes - or at least to show you what really matters if you want to invest sustainably.
Five examples are particularly influential. They mark the turning points at which I went from being a pure yield hunter to a structured investor.
1. historical performance overvalued
My entry into the $INRG (+2,24 %) (iShares Global Clean Energy ETF) was, in retrospect, almost textbook bad timing. I bought when the story sounded perfect: energy transition, political tailwinds, ESG money, green euphoria. The share price was close to an all-time high and fund providers were outbidding each other with promises for the future.
I let myself be dazzled - not by fundamentals, but by charts and headlines. The ETF portfolio consisted mainly of highly valued solar and hydrogen stocks with P/E ratios that were beyond all reason. I didn't really understand the product and only saw the impressive historical performance.
After a few months, I was down around -17% and realized the loss - a classic example of past performance bias. Today, the ETF is trading significantly lower again.
Learning:
High historical returns are not an argument, but a warning. When a sector is already overrun by institutional money, the regression to the mean begins. Since then, I have checked the composition, valuation levels and the cycle of the narrative for every investment. An ETF is only as good as its components - and hype is no substitute for analysis.
2. value trap instead of value opportunity
$INTC (-7,3 %) (Intel) seemed to me at the time to be a classic underperformance opportunity: lower P/E ratio than $NVDA (+2,31 %) (NVIDIA) or $AMD (+6,32 %) (Advanced Micro Devices), solid cash flow, decent dividend. I saw the numbers, not the structure.
The company has been struggling for years with innovation gaps, manufacturing problems and a protracted strategy. Margins were falling, market share was shrinking - but the valuation looked attractive. This is precisely the nature of a value trap: cheap because the business model is losing competitiveness.
I held on to the thesis for too long and eventually realized a loss of around -21 %. Despite the current upswing, Intel is still lagging behind today, while its competitors have further extended their lead.
Learning:
Valuation alone is not a safety net. Favorable multiples are often a symptom, not an opportunity. I have learned that capital flows, technological dynamics and management quality are crucial. Value only works if the business model is intact - not if you are hoping for a renaissance that is fundamentally unproven.
3. "What falls is cheap" - the fallacy using the example of $PYPL (+0,12 %)
(PayPal)
Another classic mistake: the belief that a sharp fall in the share price is automatically a good entry point. After PayPal's massive correction in 2021, I thought this was a rare opportunity. The company was once overvalued - no question - but I interpreted the setback as a downward exaggeration.
I got in after the share had already fallen sharply and even bought more as it continued to fall. The assumption: "It won't fall that low again." But it continued to fall - and has not recovered sustainably to this day. The exaggerated valuation premium from the boom years was simply no longer justified.
In the end, I realized a loss of around -44 %. The share will probably never reach the old highs again because the market environment, margin structure and growth have changed permanently.
Learning:
A falling share price does not automatically make a share cheap. You have to examine why it has fallen - and whether the fundamental situation has changed. An exaggeration on the upside is often followed by an overcorrection on the downside, and the old valuation remains out of reach for years. Today, I prefer to invest in companies whose trend is intact instead of speculating on "comebacks".
4. warning signals ignored - the example $CLI (+2,81 %)
(Cliq Digital)
For those unfamiliar with CLIQ, the company positions itself as a streaming provider - similar to $NFLX (-1,61 %) (Netflix), only much more niche. On paper, everything seemed to fit: high margins, strong growth, an attractive dividend and a barely noticed small cap with potential.
I saw the opportunities - but not the contradictions. The business model was difficult to understand, the reporting was incomplete and the short interest was extremely high. Nevertheless, I held on to the position - "because the figures were so good".
In the end, I realized a loss of around -26 %, including dividends. Today, the value is almost 90 % lower.
Learning:
If you don't understand a business model, it's not a good idea to be invested. Transparency is not a nice-to-have, but a must. In small caps in particular, you should check carefully whether growth is real, repeatable and sustainable. Since this experience, I have avoided business models that I cannot explain in two sentences - and take high short ratios as a serious warning signal.
5. trend understood - implementation missed
I wanted to focus on the self-service trend early on: Terminals for fast food chains, supermarkets, airports. A massive growth market - but I was looking for the wrong player. I found $M3BK (+0,32 %) (Pyramid), a small German company with a reverse IPO structure, hardly any investor relations, low liquidity and a non-transparent balance sheet.
I invested, convinced by the trend - not the business model. The share fell for months and I realized a loss of around -34%. Today it is trading at penny stock level.
Learning:
A strong trend alone does not make a good investment. The decisive factor is who has the real leverage in the value chain. It is often not the visible brands that benefit, but the blade manufacturers in the background - suppliers, infrastructure companies, platform providers. I have learned to analyze the ecosystem first and then look for the most profitable position in it.
Overarching learnings
These five mistakes were expensive, but their impact was priceless. Today, they are an integral part of my methodology - both in the 10B model (for growth opportunities) and in the Hidden Quality Radar (for quality values).
1. foundation beats narrative:
Stories are loud, but numbers are honest. Today, I check every investment for cash flow quality, return on capital and strategic positioning - and only then for valuation.
2. timing is crucial - but only in the right context:
I used to think that timing was unimportant, the main thing was to invest for the long term. Today I have a more differentiated view: the time of entry is a decisive factor in determining the risk/reward profile. If you buy in euphoric phases, you often pay for the correction years later. On the other hand, those who invest in downward exaggerations - with fundamental analysis and patience - gain a massive advantage. Timing is therefore not a game of chance, but the result of preparation, market observation and discipline.
3. accept small losses:
Discipline beats hope. Getting out early when things go wrong saves capital for better opportunities.
Here I would like to recommend a great article by @DonkeyInvestor recommend: https://getqu.in/eymPwi/
4 Transparency and management count:
I only invest in companies whose strategy and communication are transparent. Trust is not a gut feeling, but a data point.
These experiences have shaped the way I think today: patience instead of greed, quality before valuation, understanding before actionism. I have learned that you don't always have to be right on the stock market - you should think consistently.
Mistakes are inevitable. But if you reflect on them honestly, you build up your expertise with every bad experience.
What mistakes have shaped you - and what have you learned from them?

6363
16 Commentaires
Thanks for the article.
I also find myself in a few things.
Now I'm really trying to understand the reasons why hypes arise, why a share falls, sinks, etc.
A mistake I made yesterday:
I am convinced of $RACE, invested all my liquid cash yesterday instead of waiting a bit. It was a rare opportunity, so to speak.
As you can see now, today would have been a better opportunity.
Learning = Don't let your greed drive you and sometimes watch the market from the sidelines. The stock market always likes to exaggerate in both directions.
Well, in the long term, Ferrari is one of my favorites and almost a collector's item.
•
44
•
2Sem.·
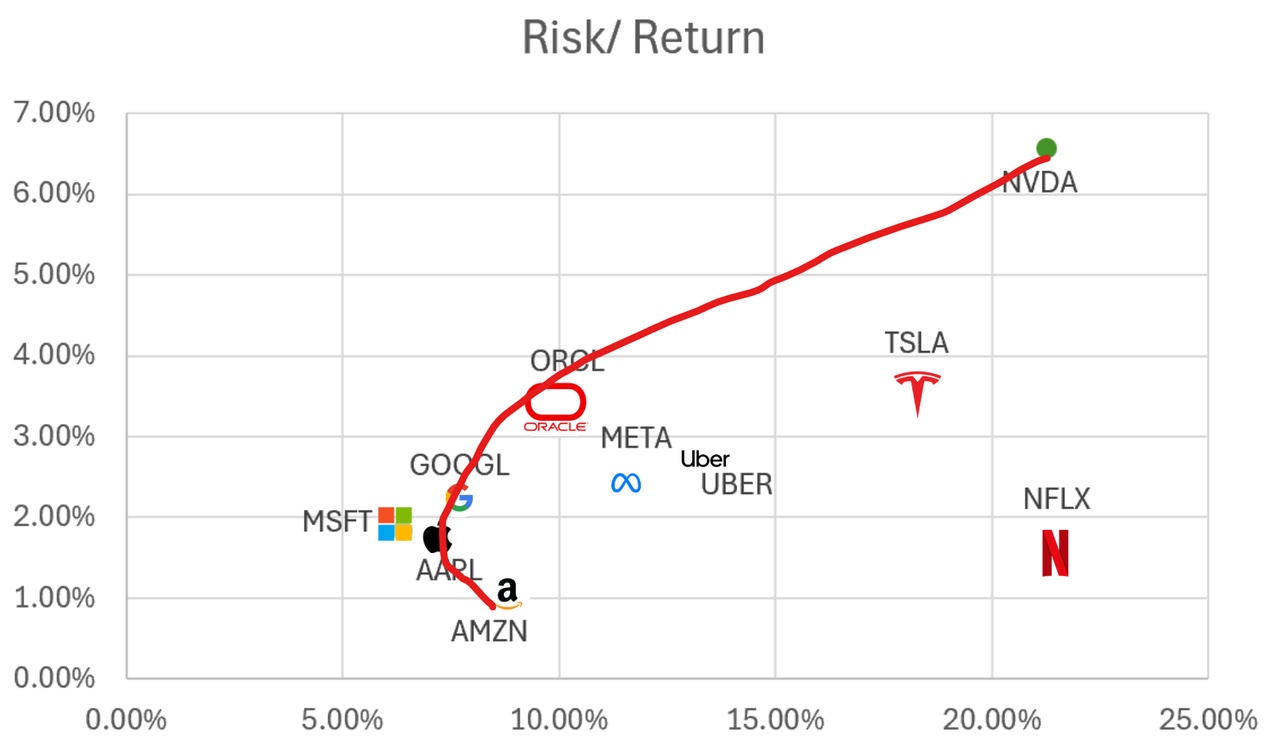
+++ Buy these shares +++
For fun, I took a textbook (risk/return) approach with an efficient frontier analysis. This would make you buy these stocks
$AMZN (+1,56 %)
$AAPL (+1,23 %)
$MSFT (+0,63 %)
$GOOGL (+1,8 %)
$ORCL (+1,12 %) and $NVDA (+2,31 %)
Do not buy the following shares:
$TSLA (-3,07 %)
$NFLX (-1,61 %)
$UBER (-0,67 %) and with $META (+0,46 %) you can argue!
I also think conservative approaches are good to strengthen his thesis - I have Amazon, Alphabet and Nvidia in my portfolio :)
99
15 Commentaires
2Sem.
You must also be a copy trader. 😉 I have exactly the same 3😎😂
••
Titres populaires
Meilleurs créateurs cette semaine
Données en temps réel par LSX · Données financières de FactSet