The dividends received in the screenshot do not quite match, as only those from the holding company are listed. The total net amount is €510.
Discussion sur BLK
Postes
65Megatrend robotics, freshly updated, added value guaranteed!
After my first post on humanoid robots received a lot of positive feedback, I went into more detail. I have subsequently added my favorites in each sector.
Extended analysis of the value chain including shovel manufacturers and potential hidden champions
New categorySecondary key sectors (sales, marketing, financing)
In additionTop 25 companies worldwide, as well as Top 10 Europe and Top 10 Asia
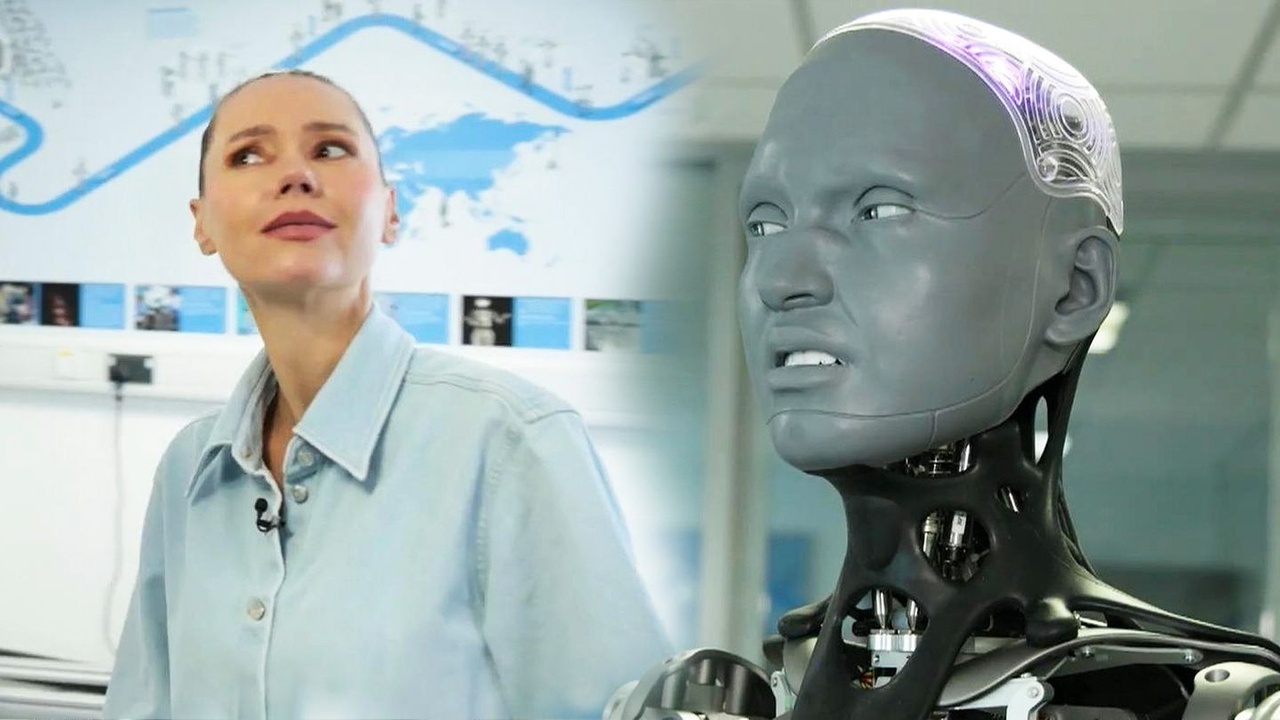
I have also added a video link for beginners. This will give you an idea of how far the development of humanoid robotics has already progressed.
Thank you for your attention and your support 🙏
🌐 1. value chain of humanoid robots (with hidden champions)
1. research & chip design
$ARM (-3,24 %) ARM (UK) - CPU-IP, energy-efficient processors
$SNPS (-3,14 %) Synopsys (US) - EDA software, chip design
$CDNS (-2,87 %) Cadence (US) - EDA & Simulation
$PTC PTC (US) - Engineering Software, CAD/PLM
$DSY (+1,32 %) Dassault Systèmes (FR) - 3D Design & Digital Twin
$SIE (-0,46 %) Siemens (DE) - Industrial Software & Lifecycle Mgmt
$ADBE (-3,55 %) Adobe (US) - Design, AR/UX
ANSYS (US) - multiphysical simulation - acquisition by Synopsis
Altair (US) - CAE, simulation, digital twin - acquisition by Siemens
$HXGBY (-0,75 %)
Hexagon (SE) - Metrology & Simulation
$AWE (+0 %) Alphawave IP Group (UK) - High-speed chip IP for AI/robotics
1.Synopsis, 2.Siemens and 3.Adobe are my top 3 in this sector
2. manufacturing technology & equipment
$ASML (+1,12 %) ASML (NL) - Lithography (EUV)
$AMAT (-0,43 %) Applied Materials (US) - Semiconductor equipment
$8035 (+3,76 %) Tokyo Electron (JP) - wafer fabrication
$KEYS (-1,08 %) Keysight Technologies (US) - Metrology
$6857 (-1,33 %) Advantest (JP) - Chip test systems
$TER (-3,3 %) Teradyne (US) - test systems + cobots
$6954 (-0,25 %) Fanuc (JP) - Industrial robots, CNC
$CAT (+0,48 %) Caterpillar (US) - autonomous machines
$KU2G KUKA (DE) - industrial robots
Comau (IT) - automation - not listed on the stock exchange
$ROK Rockwell Automation (US) - industrial automation
$JBL (-0,11 %) Jabil (US) - contract manufacturing (EMS/ODM)
$KIT (+0,23 %) Kitron (NO) - European EMS/ODM manufacturer
$AIXA (+0,68 %) Aixtron (DE) - deposition equipment for compound semiconductors
$LRCX (+1,38 %)
Lam Research (US) - Etch/deposition systems
$MKSI (-0,79 %)
MKS Instruments (US) - Plasma/vacuum technology
$ASM (-0,7 %)
ASM International (NL) - Deposition systems
1.ASML, 2.Keysight Technologies, 3.Fanuc are my top 3 in this sector
3. chip manufacturing (foundries)
$TSM (+0,23 %) TSMC (TW) - leading foundry
$005930 Samsung Electronics (KR) - foundry + memory
$GFS (-1,1 %) GlobalFoundries (US) - specialty chips
$INTC (-2,38 %)
Intel Foundry Services (US) - new western foundry player
$981
SMIC (CN) - largest Chinese foundry
$UMC
UMC (TW) - Power/RF/Embedded chips
1.TSMC, 2.Intel, 3.Samsung Electronics are my top 3 in this sector
4. computing & control unit ("brain")
$NVDA (+0,32 %) Nvidia (US) - GPUs, AI chips
$INTC (-2,38 %) Intel (US) - CPUs, FPGAs
$AMD (+1,66 %) AMD (US) - CPUs, GPUs
$MRVL (+0,92 %) Marvell (US) - network chips
$MU Micron (US) - Memory
$DELL (-0,26 %) Dell Technologies (US) - Edge & Infrastructure
Graphcore (UK) - AI chips (IPU) - not a listed company
Cerebras (US) - Wafer-scale engine - not a listed company
SiPearl (FR) - European HPC chip - not a listed company
1.Nvidia, 2.Marvell, 3.Micron are my top 3 in this sector
5. sensors ("senses")
$6758 (+0,65 %) Sony (JP) - image sensors
$6861 (-0,37 %) Keyence (JP) - Industrial sensors
$STM (-0,9 %) STMicroelectronics (FR/IT) - Sensors, MCUs
$TDY Teledyne (US) - optical/infrared sensors
$CGNX (-0,21 %) Cognex (US) - Machine Vision
$HON (-1,51 %) Honeywell (US) - sensor technology, security
ANYbotics (CH) - autonomous sensor fusion - not a listed company
$AMBA (-3,15 %) Ambarella (US) - video & computer vision SoCs for real-time image recognition
$OUST
Velodyne Lidar (US) - Lidar sensors - acquisition by Ouster
$AMS (-0,85 %)
-OSRAM (AT/DE) - optical sensors
1.Teledyne, 2.Keyence, 3.Ouster are my top 3 in this sector
6. actuators & power electronics ("muscles")
$IFX (-0,36 %) Infineon (DE) - Power Electronics
$ON (-1,18 %) onsemi (US) - Power & Sensors
$TXN (-0,87 %) Texas Instruments (US) - Mixed-Signal Chips
$ADI (-1,52 %) Analog Devices (US) - Signal Processing
$PH Parker-Hannifin (US) - Hydraulics/Pneumatics
$MP (+0 %) MP Materials (US) - Magnets
$APH (-0,32 %) Amphenol (US) - Connectors
$6481 (-0,42 %) THK (JP) - Linear guides & actuators
$6324 (-0,69 %)
Harmonic Drive (JP) - Precision gears & servo drives for robotics
$6594 (+4,01 %)
Nidec (JP) - Electric motors
$6506 (-0,87 %)
Yaskawa (JP) - Drives & Robotics
$SU (+1,17 %)
Schneider Electric (FR) - Energy & control solutions
$ZIL2 (-0,16 %)
ElringKlinger (DE) - Battery & fuel cell technology, lightweight construction
1.Parker-Hannifin, 2.MP Materials, 3.Infinion are my top 3 in this sector
7. communication & networking ("nerves")
$QCOM (+0,26 %) Qualcomm (US) - mobile communications, edge AI
$ANET (-8,99 %) Arista Networks (US) - Networks
$CSCO (-1,67 %) Cisco (US) - Networks, Security
$EQIX (-1,13 %) Equinix (US) - Data centers
NTT Docomo (JP) - 5G/6G carrier - not a listed company
$VZ Verizon (US) - Telecommunications
$SFTBY SoftBank (JP) - Carrier + Robotics
$ERIC B (-1,42 %)
Ericsson (SE) - 5G/IoT infrastructure
$NOKIA (-2,11 %)
Nokia (FI) - 5G/6G for industry
$HPE (-0,24 %)
Juniper Networks (US) - Network technology - acquisition by HP
1.Arista Networks, 2.SoftBank, 3.Cisco are my top 3 in this sector
8. energy supply
$3750 (+0,21 %) CATL (CN) - Batteries
$6752 (+0,91 %) Panasonic (JP) - Batteries
$373220 LG Energy (KR) - Batteries
$ALB (+1,02 %) Albemarle (US) - Lithium
$LYC (-0,15 %) Lynas (AU) - Rare earths
$UMICY (+1,26 %) Umicore (BE) - recycling
WiTricity (US) - inductive charging - not a listed company
$ABBN (+0,15 %) Charging (CH) - charging infrastructure
$SLDP
Solid Power (US) - Solid state batteries
Northvolt (SE) - European batteries - not a listed company
$PLUG
Plug Power (US) - fuel cells
$KULR (+1,05 %)
KULR Technology (US) - Thermal management & battery safety for mobile systems
1.Albemarle, 2.CATL, 3.Panasonic are my top 3 in this sector
9. cloud & infrastructure
$AMZN (-0,74 %) Amazon AWS (US) - Cloud, AI
$MSFT (+1,74 %) Microsoft Azure (US) - Cloud, AI
$GOOG (+0 %) Alphabet Google Cloud (US) - Cloud, ML
$VRT
Vertiv Holdings (US) - Data center infrastructure (UPS, cooling, edge)
$ORCL (-4,69 %)
Oracle Cloud (US) - ERP + Cloud
$IBM (-1,41 %)
IBM Cloud (US) - Hybrid cloud + AI
$OVH (+3,73 %)
OVHcloud (FR) - European cloud
1.Alphabet, 2.Microsoft, 3.Oracle are my top 3 in this sector
10. software & data platforms
$PLTR (+4,15 %) Palantir (US) - Data integration
$DDOG (-1,51 %) Datadog (US) - Monitoring
$SNOW (-2,18 %) Snowflake (US) - Data Cloud
$ORCL (-4,69 %) Oracle (US) - Databases, ERP
$SAP (+0,06 %) SAP (DE) - ERP systems
$SPGI (-1,16 %) S&P Global (US) - financial/market data
ROS2 Foundation - robotics middleware - not listed on the stock exchange
$NVDA (+0,32 %) NVIDIA Isaac (US) - robotics development - part of Nvidia
$INOD (+2,42 %) Innodata (US) - data annotation & AI training data
$PATH (-2,61 %)
UiPath (RO/US) - Robotic process automation
$AI (+0,5 %)
C3.ai (US) - AI platform
$ESTC (-1,86 %)
(NL/US) - Search & data analysis
1.S&P Global, 2.Palantir, 3.Datadog are my top 3 in this sector
11. end applications / robots
$ABB ABB (CH/SE) - Industrial Robots
$6954 (-0,25 %) Fanuc (JP) - Industrial robots
$TSLA (+7,29 %) Tesla Optimus (US) - humanoid robot
$9618 (-2,08 %) JD.com (CN) - logistics robot
$AAPL (+1,9 %) Apple (US) - Platform & UX
$700 (+0,52 %) Tencent (CN) - Platform & AI
$9988 (+0,34 %) Alibaba (CN) - logistics & platform
PAL Robotics (ES) - humanoid robots - not a listed company
Neura Robotics (DE) - cognitive humanoid robots - not a listed company
$TER (-3,3 %) Universal Robots (DK) - cobots - belongs to the Teradyne Corporation
Engineered Arts (UK) - humanoid robots - not a listed company
$ISRG (-2,09 %) Intuitive Surgical (US) - surgical robotics
$GMED (-1,18 %)
Globus Medical (US) - surgical robotics (ExcelsiusGPS platform)
$7012 (-2,58 %) Kawasaki Heavy Industries (JP) - industrial robots, automation
$CPNG (+0,15 %) Coupang (KR) - Logistics end user
$IRBT (-5,83 %)
iRobot (US) - consumer robotics (e.g. Roomba), non-humanoid, but navigation/sensor fusion
Boston Dynamics (US) - humanoid & mobile robots-no listed company
Hanson Robotics (HK) - humanoid robots (Sophia) - not a listed company
Agility Robotics (US) - humanoid robot "Digit" - not a listed company
1.Apple, 2.Tencent, 3.Alibaba are my top 3 in this sector
🛠 2. cross enablers (shovel manufacturers) - with hidden champions
Raw materials & battery materials
Albemarle - Lynas - Umicore
$SQM
SQM (CL) - Lithium
$ILU (+4,78 %)
Iluka Resources (AU) - Rare earths
$ARR (+1,85 %)
American Rare Earths (US/AU) - New supply chains
my number 1 in the sector is Albemarle
manufacturing technology
ASML - Applied Materials - Tokyo Electron
$LRCX (+1,38 %)
Lam Research (US) - Plasma/etching processes
$ASM (-0,7 %)
ASM International (NL) - ALD equipment
$MKSI (-0,79 %)
MKS Instruments (US) - Plasma/vacuum technology
my number 1 in the sector is ASML
Quality assurance
Keysight - Advantest - Teradyne
$EMR (-1,76 %)
National Instruments (US) - Measurement technology - from Emerson Electric adopted
$300567
ATE Test Systems (CN) - test systems
$FORM (-1,53 %)
FormFactor (US) - Wafer probing
my number 1 in the sector is Keysight
Motion & Drive
Parker-Hannifin
Festo (DE) - Pneumatics, Soft Robotics - not a listed company
Bosch Rexroth (DE) - Drives, Controls - not a listed company
$6481 (-0,42 %)
THK (JP) - Linear guides
my number 1 in the sector is Parker-Hannifin
Sensors/Imaging
$TDY Teledyne
$BSL (+2,44 %) Basler (DE) - Industrial cameras
FLIR (US) - Thermal imaging sensors - acquisition by Teledyne
ISRA Vision (DE) - Machine Vision - not a listed company
my number 1 in the sector is Teledyne
Magnets & Materials
MP Materials
$6501 (-3,32 %)
Hitachi Metals (JP) - Magnetic materials
VacuumSchmelze (DE) - Magnetic materials - not a listed company
$4063 (-1,01 %)
Shin-Etsu Chemical (JP) - Specialty materials
my number 1 in the sector is MP Materials
Chip Design & Simulation
Synopsys - Cadence - ARM
$SIE (-0,46 %)
Siemens EDA (DE/US)-Mentor Graphics-strategic business unit of Siemens AG
Imagination Tech (UK) - GPU-IP - not a listed company
$CEVA (-0,74 %)
CEVA (IL) - Signal Processor IP
my number 1 in the sector is Synopsys
Engineering & Lifecycle
PTC - Dassault - Siemens
Altair (US) - Simulation - no longer a listed company
$HXGBY (-0,75 %)
Hexagon (SE) - Metrology
$SNPS (-3,14 %)
ANSYS (US) - Simulation - takeover by Synopsys
my number 1 in the sector is Siemens
Networks & Data Centers
Arista - Cisco - Equinix
$HPE (-0,24 %)
Juniper (US) - Networks - Acquisition of HPE
$DTE (-0,15 %)
T-Systems (DE) - Industry cloud
$OVH (+3,73 %)
OVHcloud (FR) - European cloud
my number 1 in the sector is Arista
Cloud infrastructure
AWS - Azure - Google Cloud
$ORCL (-4,69 %)
Oracle Cloud (US) - ERP & databases
$IBM (-1,41 %)
IBM Cloud (US) - Hybrid Cloud
$9988 (+0,34 %)
Alibaba Cloud (CN) - Asian Cloud
$VRT
Vertiv Holdings (US) - Cloud/Infra
my number 1 in the sector is Alphabet (Google)
finance/information infra
S&P Global
$MCO
Moody's (US) - Ratings
$MSCI (-0,24 %)
MSCI (US) - Indices
$MORN
Morningstar (US) - Investment Research
my number 1 in the sector is S&P Global
Creative/Experience Infra
Adobe
$ADSK (-1,08 %)
Autodesk (US) - CAD & Design
$U
Unity (US) - 3D/AR simulation
Epic Games (US) - Unreal Engine - not a listed company
my number 1 in the sector is Adobe
Platform & Ecosystem
Apple - Tencent - Alibaba
$META (+0,41 %)
Meta (US) - AR/VR, Social Robotics
ByteDance (CN) - AI & platforms - not a listed company
$9888 (+2,67 %)
Baidu (CN) - AI & Cloud
my number 1 in the sector is Tencent
Infrastructure/Edge
Dell
$HPE (-0,24 %)
HPE (US) - Edge Computing
$SMCI
Supermicro (US) - AI servers
$6702 (-0,59 %)
Fujitsu (JP) - Edge & HPC
my number 1 in the sector is Dell
storage solutions
Micron
$000660
SK Hynix (KR) - Memory
$285A (+6,22 %)
Kioxia (JP) - NAND
$WDC
Western Digital (US) - Storage solutions
my number 1 in the sector is Micron
🏛 3. secondary key sectors with hidden champions
Financing & Capital
$GS (-0,52 %) Goldman Sachs (US) - investment bank; ECM/DCM, M&A, growth financing
$MS Morgan Stanley (US) - investment bank; tech banking, capital markets
$BLK (-1,22 %) BlackRock (US) - asset manager; capital allocation, ETFs/index funds
$9984 (+0,72 %) SoftBank Vision Fund (JP) - mega VC; growth equity in robotics/AI
Sequoia Capital (US) - venture capital; early/growth in AI/robotics - this is a classic venture capital fund
DARPA (US) - government R&D funding (robotics/defense) - independent research and development agency
EU Horizon (EU) - research funding/grants for DeepTech - Innovative Europe pillar
China State Funds (CN) - state industry/technology fund
Lux Capital (US) - VC for DeepTech - Uptake (US) - AI-based predictive maintenance
DCVC (US) - Robotics & AI focus - investing exclusively via VC fund investments
Speedinvest (AT) - EU VC for robotics - access to investment only via fund investments
my number 1 in the sector is Softbank
Maintenance & Service
$SIE (-0,46 %) Siemens (DE) - Industrial Service, Lifecycle & Retrofit
$ABBN (+0,15 %) ABB (CH/SE) - Robotics Service, Spare Parts, Field Support
$GEHC (-1,63 %) GE Healthcare (US) - Medtech service incl. robotic systems
Uptake (US) - AI-based predictive maintenance - not a listed company
Augury (US/IL) - condition monitoring, condition diagnostics - not a listed company
$KU2 KUKA Service (DE) - Robotics maintenance
$6954 (-0,25 %) Fanuc Service (JP) - global service network
Boston Dynamics AI Institute (US) - Robotics longevity - funded by Hyundai Motor Group
my number 1 in the sector is Siemens
Marketing & Advertising
$WPP (+0 %) WPP (UK) - global advertising group; branding/communications
$OMC Omnicom (US) - marketing/PR network
$PUB (+1,47 %) Publicis (FR) - communications/advertising group
$META (+0,41 %) Meta (US) - Digital Ads (Facebook/Instagram)
$GOOG (+0 %) Google Ads (US) - search & display advertising
TikTok / ByteDance (CN) - social ads & distribution - not a listed company
$AAPL (+1,9 %) Apple (US) - Branding/UX; Acceptance & Platform Marketing
$WPP (+0 %)
AKQA (UK/US) - Tech branding - Since 2012 majority owned by the WPP Groupbut continues to operate as an autonomous operating unit
R/GA (US) - Innovation marketing - not a listed company
Serviceplan (DE) - largest independent EU agency - not a listed company
my number 1 in the sector is Meta
Law, Regulation & Ethics
ISO (CH) - international standards, robotics standards
TÜV (DE) - certification & safety tests
UL (US) - safety/conformity testing
EU AI Act (EU) - legal framework for AI & robotics
UNESCO AI Ethics (UN) - global ethics guidelines
Fraunhofer IPA (DE) - Robotics safety standards
ANSI (US) - standards
IEC (CH) - Electrical engineering standards
Training & Talent
MIT (US) - Robotics/AI Research & Education
ETH Zurich (CH) - autonomous systems & robotics
Stanford (US) - AI/Robotics labs & spin-offs
Tsinghua University (CN) - Robotics/AI in Asia
CMU (US) - Robotics Institute
EPFL (CH) - Robotics research
TU Munich (DE) - humanoid robot "Roboy"
🌍 Top 25 companies for humanoid robotics
These companies are central to the development & production of humanoid robotsbecause without them, crucial parts of the chain would be missing:
Chips & computing power (brain of the robots)
$NVDA (+0,32 %) Nvidia (US) - AI GPUs & Isaac platform, foundation for robotic AI
$2330 TSMC (TW) - world's most important foundry, produces the AI chips
$ASML (+1,12 %) ASML (NL) - EUV lithography, indispensable for chip production
$005930 Samsung Electronics (KR) - memory, logic, foundry
$000660 SK Hynix (KR) - DRAM & NAND memory for AI
$MU Micron (US) - Memory solutions for AI workloads
my number 1 in the sector is ASML
Sensors & perception (senses of robots)
$SONY Sony (JP) - image sensors, market leader
$6861 (-0,37 %) Keyence (JP) - Industrial sensors & vision systems
$CGNX (-0,21 %) Cognex (US) - Machine Vision, precise image processing
my number 1 in the sector is Keyence
Actuators & motion (muscles of robots)
$IFX (-0,36 %) Infineon (DE) - power electronics, motor control
$6594 (+4,01 %) Nidec (JP) - World market leader for electric motors
$PH Parker-Hannifin (US) - hydraulics/pneumatics, motion technology
$6481 (-0,42 %) THK (JP) - Linear guides & actuators
my number 1 in the sector is Parker-Hannifin
Communication, cloud & infrastructure (nerves & data flow)
$QCOM (+0,26 %) Qualcomm (US) - Mobile & Edge Chips
$AMZN (-0,74 %) Amazon AWS (US) - Cloud & AI infrastructure
$MSFT (+1,74 %) Microsoft Azure (US) - Cloud, AI services
$CSCO (-1,67 %) Cisco (US) - Networks & Security
$VRT Vertiv Holdings (US) - Data Center Infrastructure
my number 1 in the sector is Microsoft
End Applications & Platforms (robots themselves)
$TSLA (+7,29 %) Tesla (US) - humanoid robot Optimus
$ABBN (+0,15 %) ABB (CH/SE) - Robotics & Automation
$6954 (-0,25 %) Fanuc (JP) - industrial robots & CNC systems
$7012 (-2,58 %) Kawasaki Heavy Industries (JP) - industrial robots
PAL Robotics (ES) - humanoid robots (TALOS, ARI, TIAGo) - not a listed company
Neura Robotics (DE) - cognitive humanoid robots - not a listed company
Universal Robots (DK) - cobots
my number 1 in the sector is Tesla
🇪🇺 Top 10 European key companies for humanoid robotics
$ASML (+1,12 %)
ASML (NL)
World market leader in EUV lithography - no modern chips for AI & robotics without ASML.
$IFX (-0,36 %) Infineon (DE)
Leading in power electronics & motor control - crucial for actuators of humanoid robots.
$STM (-0,9 %)
STMicroelectronics (FR/IT)
Sensors, microcontrollers & power chips - the basis for control & perception.
$SAP (+0,06 %)
SAP (DE)
ERP & data platforms, important for integrating humanoid robots into industrial processes.
$SIE (-0,46 %)
Siemens (DE)
Industrial software, automation, digital twin - key for engineering & lifecycle management.
$KU2 KUKA (EN)
Robotics pioneer, industrial robots & automation - know-how for humanoid motion mechanics.
PAL Robotics (ES) - not a listed company
Specialist for humanoid robots (TALOS, ARI, TIAGo), internationally used in research & service.
Neura Robotics (DE) - Not a listed company
Young high-tech company, develops cognitive humanoid robots with advanced AI (4NE-1).
Universal Robots (DK) - Not a listed company
Market leader for cobots - platform for safe human-robot collaboration.
Engineered Arts (UK) - not a listed company
Develops humanoid robots such as Amecaknown for realistic facial expressions & gestures - important for HRI (Human-Robot Interaction)
🌏 Top 10 Asian key companies for humanoid robotics
$2330
TSMC (Taiwan)
World's largest semiconductor foundry, produces high-end chips (e.g. Nvidia, AMD, Apple) - no AI hardware without TSMC.
$005930
Samsung Electronics (South Korea)
Foundry, memory, logic chips, image sensors - extremely broadly positioned in robotics components.
$000660
SK Hynix (KR) - Memory
$SONY
Sony (Japan)
Market leader in CMOS image sensors, essential for robotic vision & perception.
$6861 (-0,37 %)
Keyence (Japan)
Sensor technology & machine vision for industrial automation, widely used in robotics.
$6954 (-0,25 %)
Fanuc (Japan)
Industrial robots & CNC systems, one of the most important manufacturers of robotics hardware worldwide.
$6506 (-0,87 %)
Yaskawa Electric (Japan)
Drives, motion control & robot arms - relevant for humanoid motion control.
$6594 (+4,01 %)
Nidec (Japan)
World market leader for electric motors (from mini motors to high-performance drives).
$7012 (-2,58 %)
Kawasaki Heavy Industries (JP) - Industrial robots
$9618 (-2,08 %)
JD.com (China)
Driver for robotics in e-commerce & logistics, invests in humanoid robotics applications

Build robots, earn shovels
The hype is all about humanoid robots, but the constant winners are in the background.
I have divided the analysis into two perspectives. 1. the complete value chain of humanoid robots, which shows all the players from the chip to the finished robot, and 2. the blade manufacturers in the background, who always earn money as enablers, regardless of which manufacturer wins the race.
ASML, Applied Materials and Tokyo Electron dominate in manufacturing technology. Quality assurance comes from Keysight, Advantest and Teradyne. Chip design is supported by Synopsys, Cadence and ARM. Data streams are secured by Arista Networks, Cisco and Equinix. The computing basis is created in the cloud by Amazon, Microsoft and Alphabet. Albemarle, Lynas and Umicore play a central role in raw materials and battery materials. These companies monetize their customers' investment waves, have high barriers to entry, service revenues and pricing power, but remain cyclical with risks from export rules, capex cuts and currency movements.
🌐 Value chain of humanoid robots Sector overview
1. research & chip design (IP / EDA)
$ARM (-3,24 %)
ARM Holdings (ARM, UK/USA) - CPU architectures
$SNPS (-3,14 %)
Synopsys (SNPS, USA) - Chip design software
$CDNS (-2,87 %)
Cadence Design Systems (CDNS, USA) - EDA & Simulation
2. manufacturing technology & equipment
$ASML (+1,12 %)
ASML (ASML, NL) - EUV lithography, key monopoly
$AMAT (-0,43 %)
Applied Materials (AMAT, USA) - Process equipment
$8035 (+3,76 %)
Tokyo Electron (8035.T, JP) - Wafer equipment
$KEYS (-1,08 %)
Keysight Technologies (KEYS, USA) - Test & RF measurement technology
$6857 (-1,33 %)
Advantest (6857.T, JP) - Semiconductor test systems
$TER (-3,3 %)
Teradyne (TER, USA) - Test systems + robotics (Universal Robots)
3. chip production (Foundries)
$TSM (+0,23 %)
TSMC (TSM, TW) - Largest contract manufacturer
$005930
Samsung Electronics (005930.KQ, KR) - Memory + Foundry
$GFS (-1,1 %)
GlobalFoundries (GFS, USA) - Specialized production
4. computing & control unit ("brain")
$NVDA (+0,32 %)
Nvidia (NVDA, USA) - GPUs, AI accelerators
$INTC (-2,38 %)
Intel (INTC, USA) - CPUs, FPGAs
$AMD (+1,66 %)
AMD (AMD, USA) - CPUs/GPUs
$MRVL (+0,92 %)
Marvell Technology (MRVL, USA) - Network/data center chips
5. sensors ("senses")
$6758 (+0,65 %)
Sony (6758.T, JP) - CMOS image sensors
$6861 (-0,37 %)
Keyence (6861.T, JP) - Vision systems, sensors
$STM (-0,9 %)
STMicroelectronics (STM, CH/FR) - MEMS sensors
6. actuators & power electronics ("muscles")
$IFX (-0,36 %)
Infineon (IFX, DE) - Power semiconductors, SiC
$ON (-1,18 %)
N Semiconductor (ON, USA) - SiC/Power Chips
$STM (-0,9 %)
STMicroelectronics (STM, CH/FR) - Motor control & power
$TXN (-0,87 %)
Texas Instruments (TXN, USA) - Motor control, power ICs
$ADI (-1,52 %)
Analog Devices (ADI, USA) - Energy & BMS chips
7. communication & networking ("nerves")
$QCOM (+0,26 %)
Qualcomm (QCOM, USA) - 5G/SoCs
$AVGO (+0,14 %)
Broadcom (AVGO, USA) - Network & radio chips
$SWKS (+1,03 %)
Skyworks Solutions (SWKS, USA) - RF components
8. energy supply
$300750
CATL (300750.SZ, CN) - Batteries
$6752 (+0,91 %)
Panasonic (6752.T, JP) - Batteries for automotive/robotics
$373220
LG Energy Solution (373220.KQ, KR) - Batteries
9. cloud & infrastructure
$AMZN (-0,74 %)
Amazon (AMZN, USA) - AWS
$MSFT (+1,74 %)
Microsoft (MSFT, USA) - Azure
$GOOG (+0 %)
Alphabet (GOOGL, USA) - Google Cloud
$EQIX (-1,13 %)
Equinix (EQIX, USA) - Data center operator
$ANET (-8,99 %)
Arista Networks (ANET, USA) - Network infrastructure
$CSCO (-1,67 %)
Cisco Systems (CSCO, USA) - Edge & Data Center Networks
10. software & data platforms
$PLTR (+4,15 %)
Palantir (PLTR, USA) - Data integration, decision software
$DDOG (-1,51 %)
Datadog (DDOG, USA) - Cloud monitoring / observability
$SNOW (-2,18 %)
Snowflake (SNOW, USA) - Cloud-native data platform
$ORCL (-4,69 %)
Oracle (ORCL, USA) - Databases, ERP
$SAP (+0,06 %)
SAP (SAP, DE) - ERP/cloud systems
$PATH (-2,61 %)
UiPath (PATH, USA) - Automation software (RPA)
$AI (+0,5 %)
C3.ai (AI, USA) - Enterprise AI platform
11. end applications / robots
$ABB
ABB (ABB, CH) - Industrial robots
$6954 (-0,25 %)
Fanuc (6954.T, JP) - Industrial robots, CNC
$TSLA (+7,29 %)
Tesla (TSLA, USA) - Optimus" humanoid robot
$9618 (-2,08 %)
JD.com (JD, CN) - E-commerce & automated logistics
🛠️ Shovel manufacturer for humanoid robots
🔹 Hardtech (physical "shovels")
These companies provide the material basis: manufacturing machines, raw materials, semiconductor base.
Semiconductor Equipment & Manufacturing
$ASML (+1,12 %)
ASML (ASML, NL) - EUV lithography (monopoly).
$AMAT (-0,43 %)
Applied Materials (AMAT, USA) - Wafer equipment.
$8035 (+3,76 %)
Tokyo Electron (8035.T, JP) - Process equipment.
Test systems (hardware-side)
$6857 (-1,33 %)
Advantest (6857.T, JP) - Semiconductor test.
$TER (-3,3 %)
Teradyne (TER, USA) - Test systems + industrial robots.
Materials & raw materials
$ALB (+1,02 %)
Albemarle (ALB, USA) - Lithium (batteries).
$LYC (-0,15 %)
Lynas Rare Earths (LYC.AX, AUS) - Rare earths for magnets.
$UMICY (+1,26 %)
Umicore (UMI.BR, BE) - Cathode materials, recycling.
🔹 Soft/infra (digital "shovels")
These companies supply the infrastructure & toolswithout which development, training and operation would be impossible.
Design Software & IP
$SNPS (-3,14 %)
Synopsys (SNPS, USA) - EDA software.
$CDNS (-2,87 %)
Cadence Design Systems (CDNS, USA) - Chip design & simulation.
$ARM (-3,24 %)
ARM Holdings (ARM, UK/USA) - CPU architectures (license model).
Test & Measurement (software/signal level)
$KEYS (-1,08 %)
Keysight Technologies (KEYS, USA) - Electronics & RF test systems.
Network & data center backbone
$ANET (-8,99 %)
Arista Networks (ANET, USA) - High-speed networks.
$CSCO (-1,67 %)
Cisco Systems (CSCO, USA) - Data center/edge networks.
$EQIX (-1,13 %)
Equinix (EQIX, USA) - Data centers (colocation).
Cloud infrastructure
$AMZN (-0,74 %)
Amazon (AMZN, USA) - AWS (cloud, AI training).
$MSFT (+1,74 %)
Microsoft (MSFT, USA) - Azure.
$GOOG (+0 %)
Alphabet (GOOGL, USA) - Google Cloud.
Takeaway: Investing in the infrastructure stack allows you to participate in the robotics trend regardless of the subsequent product winner and reduces the individual product risk, but you have to live with cycles. In your opinion, which stage of the chain offers the best risk/return combination and fits into a disciplined portfolio?
Source: Own analysis based on publicly available company information and IR materials of the companies mentioned.
Image material: Techa Tungateja/iStockphoto

Black Swan: The day AI paralyzes the stock markets
AI-driven flash crash
An AI flash crash occurs when modern trading algorithms trigger massive waves of selling in a matter of seconds.
These systems are usually programmed to react to price changes or data signals, such as stop loss limits or short-term price drops.
If a share reaches a critical price, programmed algorithms automatically trigger sales.
These orders drive the price down further, causing other algorithms with similar mechanisms to also sell ("sell side momentum").
This so-called cascade effect can cause the price to plummet within minutes.
(Example: Cascade effect of critical infrastructure during heavy rainfall)
The trading speed of AI models today is so high that the smallest triggers (e.g. false signals) can result in a storm of trades in a flash.
Experts warn that many AI models are based on similar data, which can lead to "swarm thinking":
If several systems misinterpret the same signals at the same time, a small price slide can very quickly turn into a huge sell-off.
(Example: The flash crash of 6 May 2010 began with a large sell-off program being triggered for S&P 500 futures).
(https://www.advisorperspectives.com)
Although the markets recovered by the close of trading, this example shows how domino effects can be caused by automated orders.
AI can also have its own say:
Modern systems read news and social media in real time and react independently.
Bots can also incorporate completely new information (tweets or news) and generate buy or sell signals from this.
Incorrectly generated or misinterpreted messages can therefore immediately lead to sales.
1.
Possible triggers
Data error or manipulation:
Incorrect market data (prices, volumes) or cyber attacks on data can trigger false signals.
Algorithms that react blindly to data could falsely trigger sales or purchases.
The term:
"Simulation Deception"
(https://www.tencentcloud.com/techpedia/118834)
describes artificial patterns in the market that are created by manipulated data.
For example, an attacker could use fake buy/sell orders (spoofing) to artificially simulate liquidity, whereupon AI systems panic and trade in the opposite direction.
Fake news and deepfakes:
Artificial intelligence now allows deceptively real false reports (deepfake video, fake tweets, etc.).
(Example: on July 16, 2025, Congress member Anna Paulina Luna from Florida wrote on X (Twitter) that she had heard from President Trump that Fed chief Powell would be fired immediately).
(https://www.advisorperspectives.com)
AI searched all social media posts specifically for tradable news. It found what it was looking for and a violent reaction in the bond and stock markets followed, as shown above.
In previous cases, the impact might have been weaker, as the president could have reacted more quickly and dismissed the statements before many market participants were even aware of the rumor.
Even little-known posts can lead to strong market movements within minutes thanks to AI attention.
World Economic Forum analyses explicitly warn:
Machine-generated fake news can act like a flash crash trigger.
More and more bots are able to spread such false information in order to deceive trading algorithms.
AI misinterpretation:
Even if the data is correct, AI models can misinterpret it.
Trading algorithms that process complex data (news, technical indicators) run the risk of interpreting irrelevant noise as a signal.
Lawfare cites as an example that AI-supported systems already "misread" the market in 2010 and 2016. "misread" the market and launched unfounded waves of selling.
"A few algorithms in use simply misread
the market. The unwarranted sell-off initiated by those mistaken models then caused other programs to respond in kind. The $1 trillion lost in that half hour period was eventually made up thanks to human intervention. "
In the future, such misinterpretations will be even more critical as AI models analyze huge amounts of data from social media and news.
Panic signals/cascades:
In a battered market, automated risk offs (stop sales after a fixed loss limit) can trigger a race.
If, for example, a key figure ($VIXindex level) reaches a critical value, many systems switch to safety at the same time - which can cause a variety of similar assets to fall as an artificial panic impulse.
2.
Affected asset classes
An AI Flash Crash affects various asset classes:
Equities:
This is often the first impetus of a crash.
Globally listed stocks (indices such as S&P 500, DAX, Nikkei) see massive price losses in a matter of seconds.
A shutdown of a large position, for example, can cause other algorithms to panic sell.
Historically, the stock market has experienced such sell-off waves several times.
2010 Dow $DJIA
2014 US bonds
An AI-supported flash crash would accelerate this mechanism even further. A sharp slump is usually followed by a partial recovery within a few days or weeks.
Bonds:
Bond markets can also "flash".
In the famous Treasury Flash Crash of 2014, the yield on the US 10-year Treasury Yield plummeted by 1.6% in twelve minutes, followed by a recovery - triggered by algorithmic sell orders at record levels.
(https://www.researchgate.net)
(Theoretically, AI can act against this:
In a stock panic, investors often flee into bonds (price rises, yield falls).
But AI-controlled bond funds could simultaneously and automatically reach certain thresholds and trigger the sale of bonds or bond futures.
This could lead to sharp interest rate swings in the short term, even if the fundamentals do not justify this).
Commodities:
When uncertainty is high, commodity prices often tip.
Typically, oil ($IOIL00 (+0,92 %) ), gas ($NGS ) and industrial metal prices ($COPA (+0,43 %) , $ALUM (-2,43 %) , $ZINC (+2,11 %) ) in a crash phase due to expected weaker demand.
AI programs on the commodities market (e.g. in oil or gold futures trading) could intensify this crash or even trigger a "mini flash crash" in individual commodities.
(Example: the slump in silver futures in July 2017:
Price plunge of over 11% during Asia close when thin trading was blamed on algorithm shifts).
AI in commodity markets can therefore both trigger selling spikes and initiate a rapid countermovement through post-buy programs.
Cryptocurrencies:
These are considered particularly volatile.
AI trading bots are everywhere, so cryptocurrencies are in free fall when many bots recognize "fear" signals at the same time.
(Example: In May 2021 $BTC (+0,01 %)
plummeted by around 30% within hours, partly because many algorithms sold en masse after signals about China's Bitcoin ban).
$ETH (-0,08 %) experienced a flash crash on one platform in 2017 because a huge sell order triggered many automated trades.
Crypto markets run 24/7, are unregulated and therefore more susceptible to algorithmic chain reactions.
3.
Risk matrix by region
The probability of occurrence and the extent of damage caused by a crash differ from region to region:
USA:
- Very high trading volume and dominant use of AI algorithms in New York and Chicago.
- Large index futures can act as initiators.
- Probability of a crash is considered moderate to high as there is a lot of automated trading here.
- Damage would be extremely highas the US markets are of global systemic importance.
- Trading halts mitigate the impact on the trading day, but the crash effect on global investor sentiment would be enormous.
Europe:
- Heavy reliance on passive funds and ETFs (e.g. from $BLK (-1,22 %) iShares).
- Algorithms are widespread, but somewhat less so than in the USA.
- Probability rather mediumdamage high.
- ETF crashes show that sudden panic can also lead to chain reactions in equities.
- European banking crisis could arise if credit markets are burdened by US shocks.
Asia:
- Regulation and trading times differ.
- Flash crashes can have a rapid impact on Asia (Nikkei, SSE), especially if they start at night when trading is thin.
Medium probability and medium damage - because Asian markets close faster and usually react later.- Crashes in Asia could affect yen or euro performance, for example.
Crypto:
- Market open around the clock, little regulation, high leverage.
- The probability of a major crash in crypto is very highas price falls are more frequent and driven by AI bots.
- Damage is often limited to crypto investors, but can also affect traditional markets via linked financial assets (Bitcoin ETFs, leveraged crypto products).
The matrix overview could therefore show
- Short term (minutes to days):
A sudden flash crash would last seconds to minutes.
Prices plummet, many stop loss orders are triggered.
Stock exchanges switch on automatic trading pauses to stop algorithm spirals.
Investors lose billions in a very short space of time, many markets are temporarily illiquid.
Confidence collapses, many investors panic and are uninformed.
- Medium-term (weeks to months):
Markets should stabilize again in the following days to weeks as counter-cyclical AI and manual orders intervene.
In the medium term, economic data could be affected if a crash impacts financing conditions.
Media and public will question confidence in digital markets for months.
Investors report consequences such as increased demand for safe assets (gold, government bonds).
- Long term (years):
Regulation and market mechanisms would adapt.
We could expect a regulatory boost:
- Stricter rules for AI in trading
- Transparency obligations for algorithm models
- Supervision of financial AI by regulators (SEC, BaFin, ESMA etc.).
Already in the past, the 2010 flash crash led to new trading interruptions and considerations regarding trading system requirements.
An AI crash would likely have a disciplining effect:
Providers need to develop more robust AI models, and contingency plans (kill switches) could become mandatory.
In the long term, confidence could be slow to recover:
Institutional investors would only have limited confidence in AI systems, and many private investors might temporarily hold back or prefer alternative strategies.
4.
Specific players and technologies
BlackRock Aladdin:
BlackRock's Aladdin AI system currently manages more than 30,000 portfolios and permanently rebalances enormous amounts of capital.
If Aladdin is routinely programmed to sell too much for ETFs or funds, this can trigger billions of orders.
Nvidia & AI chips:
$NVDA (+0,32 %) Supplies the hardware for many AI models and is itself a market star.
High expectations for AI have fueled Nvidia's share price for years.
Algorithms are strongly fixated on such shares.
If, for example, Nvidia's share price falls abruptly, many strategies trigger sell programs.
Such a domino effect
$NVDA (+0,32 %) -> $SEMI (+0,56 %) -> $CSNDX (+0,32 %)
could fuel a crash.
In practice, it has been shown that Nvidia reacts very volatile to macroeconomic and geopolitical news, so the next AI turbulence could drag down the entire tech sector.
AI bots on Binance (Crypto):
On crypto exchanges like Binance, many users trade with automated bots.
A large part of the crypto trading volume comes from AI-supported systems.
These bots can generate simultaneous sell or buy waves.
AI-driven ETF rebalancing:
Large index ETFs and passive funds (BlackRock iShares, Vanguard etc.) use automated systems to implement index changes.
If indices rise or fall quickly, many ETFs start rebalancing at the same time.
If the AI signal is negative, all AI-based funds could sell at the same time.
This creates massive sell orders in a short space of time.
Because the volumes involved are in the billions, rebalancing alone can drive a crash further.
Other players:
News agencies, index operators (eg. $MSCI (-0,24 %) ), hedge funds with AI strategies and social trading platforms also contribute.
Any sudden outage (e.g. power failure at NYSE) or hacker attack on stock exchange systems could further irritate the AI systems on the stock market.
"When algorithms collide and markets tremble in fractions of a second, the new power of AI is revealed: speed without mercy, precision without emotion. One spark is enough - and the domino effect races through indices, derivatives and crypto-spheres. The AI-driven flash crash is no longer a distant shadow, but the echo of a future in which machines set the pace of the financial world."
Feel free to write your feedback on this post in the comments and tell me if you're interested in something like this.
My plan this morning was actually just to write a short post about this topic, but it turned out to be a bit longer. It's so easy to sit and write all day.
@Kundenservice Please increase the maximum number of pictures for a post, unfortunately I didn't get all the pictures in that I had picked out.
Sources:
- https://www.ig.com/en/trading-strategies/flash-crashes-explained-190503#:~:text=speeds%20based%20on%20pre,as%20the%20prices%20go%20down
- https://www.advisorperspectives.com/articles/2025/07/28/ai-transforming-markets#:~:text=I%20started%20this%20article%20by,a%20flash%20crash%20or%20surge
- https://www.lawfaremedia.org/article/selling-spirals--avoiding-an-ai-flash-crash#:~:text=an%20otherwise%20normal%20trading%20day,up%20thanks%20to%20human%20intervention
- https://www.ig.com/en/trading-strategies/flash-crashes-explained-190503#:~:text=2010%20flash%20crash%3A%20Dow%20Jones
- https://www.advisorperspectives.com/articles/2025/07/28/ai-transforming-markets#:~:text=For%20example%2C%20on%20July%2016%2C,last%20week%20was%20lightning%20fast
- https://www.binance.com/en/square/post/22230680857314
- https://www.tencentcloud.com/techpedia/118834
- https://www.weforum.org/stories/2023/04/technology-vulnerabilities-financial-system/#:~:text=However%2C%20IoT%20botnets%2C%20which%20tamper,grid%20and%20influence%20market%20prices
- https://www.lawfaremedia.org/article/selling-spirals--avoiding-an-ai-flash-crash#:~:text=But%20this%20was%20not%20a,speed%20selling%20spirals.”
- https://corporatefinanceinstitute.com/resources/career-map/sell-side/capital-markets/flash-crashes/#:~:text=Using%20algorithms%20to%20trade%20has,plunge%20in%20the%20market%20occurs
- https://www.ig.com/en/trading-strategies/flash-crashes-explained-190503#:~:text=The%20flash%20crash%20of%20the,impact%20these%20events%20can%20have
- https://www.tastyfx.com/news/flash-crashes-explained-190503/#:~:text=The%20DJIA%20suffered%20yet%20another,NYSE
- https://www.occ.gov/news-issuances/speeches/2024/pub-speech-2024-61.pdf#:~:text=flash%20crashes%2C%20which%20have%20been,4
- https://www.zerodaylaw.com/blog/ai-compliance-safeguarding-financial-markets#:~:text=The%20reliance%20on%20AI%20for,reaching%20consequences
- https://www.nasdaq.com
- https://medium.com
- https://corporatefinanceinstitute.com
- https://www.tastyfx.com
- https://www.binance.com/en
- https://www.lawfaremedia.org
- https://www.weforum.org
- https://www.ig.com/de
- https://www.tencentcloud.com
- https://www.occ.gov
- https://www.ssrn.com/index.cfm/en
- https://www.advisorperspectives.com
- https://www.zerodaylaw.com
- https://www.curiousmonky.com


+ 6

Incidentally, the most famous algo crash was on October 19, 1987, when the Dow Jones fell by 22% within hours. That caused a few suicides! 🥶
New 52-week highs for these stocks
These shares reached a new 52-week high today:
Meta $META (+0,41 %)
Broadcom $AVGO (+0,14 %)
AMD $AMD (+1,66 %)
Blackrock $BLK (-1,22 %)
Astera Labs $ALAB
Arista Networks $ANET (-8,99 %)
Reddit $RDDT (-0,16 %)
Lam Research $LRCX (+1,38 %)
KLA Corp $KLAC (+1,31 %)
S&P Global $SPGI (-1,16 %)
Celsius $CELH
United Rentals $URI (-2,1 %)
Do you hold one of the shares? If yes, congratulations!
BlackRock Dividend Scalable
I received a dividend from BlackRock at Scalable today! Strange because I already got my June dividend from BlackRock! Is it possibly a mistake 🤔 Does anyone have similar experiences/problems?
Best regards $BLK (-1,22 %)
BlackRock misses sales forecasts | René Benko under indictment
BlackRock achieves record assets despite decline in turnover
BlackRock $BLK (-1,22 %) achieved an impressive record of 12.5 trillion dollars in assets under management in the second quarter of 2023. But behind this glittering figure lies a dark cloud: at 5.42 billion dollars, turnover fell short of analysts' expectations, who had expected 5.44 billion dollars. The reason for this revenue shortfall? An institutional client withdrew a whopping 52 billion dollars from the index funds, which significantly reduced net inflows. In the final hours of trading, the markets reacted sensitively: the shares fell by almost 6% after previously reaching an all-time high. Despite these setbacks, BlackRock has still been able to record an increase of around 3% in equities since the beginning of the year.
In addition to the revenue woes, BlackRock announced that the acquisition of HPS Investment Partners for $12 billion was completed as early as July 1, 2023. This acquisition brings with it not only 165 billion dollars in client assets under management, but also 118 billion dollars in fee-based assets. The question remains as to whether this strategic decision can strengthen the company in the long term or whether the current challenges will overshadow the positive effects.
René Benko faces serious charges
In the world of real estate, René Benko, who was celebrated as the star of the industry, is now facing serious legal difficulties. Prosecutors have brought charges against him based on various allegations, the details of which have not yet been disclosed. According to reports, the investigation includes extensive evidence pointing to a possible legal dismantling of his business. Benko was known for his aggressive acquisition strategies, which brought him both fame and criticism. His current situation not only raises questions about his personal future, but could also have far-reaching implications for his legacy in the real estate world. The industry is watching with interest to see how the situation will develop.
Sources:
https://finance.yahoo.com/news/blackrock-stock-tumbles-revenue-misses-160133670.html
BlackRock Q2'25 Earnings Highlights
🔹Revenue: $5.42B (Est. $5.46B) 🟡; UP +13% YoY
🔹 Adj EPS: $12.05 (Est. $10.91) 🟢; UP +16% YoY
🔹 AUM: $12.53T; UP +18% YoY
🔹 Total Net Flows: $68B; DOWN -17% YoY
🔹 Long-Term Net Flows: $46B; DOWN -64% YoY
Segment / Revenue Breakdown
🔹 Base Fees: $4.28B; UP +15% YoY
🔹 Securities Lending Revenue: $171M; UP +11% YoY
🔹 Tech Services & Subscription Revenue: $499M; UP +26% YoY
🔹 Performance Fees: $94M; DOWN -43% YoY
🔹 Distribution Fees: $320M; UP +1% YoY
Other Key Q2 Metrics:
🔹 Net Income (Adj.): $1.88B; UP +21% YoY
🔹 Operating Income (Adj.): $2.10B; UP +12% YoY
🔹 Operating Margin (Adj.): 43.3% vs 44.1% YoY
Flows by Product
🔹 iShares ETFs: +$85B
🔹 Active: +$11B
🔹 Digital Assets: +$14B
🔹 Cash Management: +$22B
🔹 Institutional Index: -$48B
Flows by Client Type
🔹 Retail: +$2B
🔹 ETFs: +$85B
🔹 Institutional: -$41B
AUM Composition
🔹 Equity AUM: $6.91T
🔹 Fixed Income AUM: $3.09T
🔹 Multi-Asset AUM: $1.08T
🔹 Alternatives AUM: $302B
🔹 Cash Management AUM: $970B
Operating Metrics
🔹 Dividend: $5.21/share
🔹 Share Repurchase: $375M
🔹 Effective Tax Rate (Adj.): 24.8%
🔹 Diluted Shares Outstanding: 156.3M; UP +4% YoY
CEO Larry Fink Commentary
🔸 “We generated 6% organic base fee growth in Q2 and 7% over the last twelve months.”
🔸 “iShares ETFs had a record first half in flows, and tech ACV growth hit 16%.”
🔸 “We surpassed the fundraising target for GIP’s fifth flagship, raising $25.2B.”
🔸 “Our comprehensive platform and depth of client relationships set us apart from traditional or private markets firms.”
🔸 “These are just the early days in our next phase of even stronger growth.”
The earnings season begins again!
As the earnings season starts again, here is a summary of the most important figures next week.
$JPM (+0,32 %)
$C (+0,76 %)
$WFC (+0 %)
$BLK (-1,22 %)
$JNJ (-0,64 %)
$GS (-0,52 %)
$BAC (-0,32 %)
$AA (+2,94 %)
$ASML (+1,12 %)
$PLD (-0,1 %)
$UAL (-2,68 %)
$KMI (+0 %)
$PEP (-0,6 %)
$ABT (+1,42 %)
$Netflix
$TSM (+0,23 %)
$USB (-0,07 %)
$IBKR (+0,54 %)
$AXP (-1,1 %)
$MMM (-0,71 %)

BlackRock 📈
Does anyone know what's going on with $BLK (-1,22 %) they are literally going through the roof 🚀🚀 Luckily I got in on time 🙂
Reduce US share?
Partly due to the following article by @Epi (many thanks for that! 👍🏻) I am considering reducing my US share in my portfolio.
Specifically, I am considering, for example, selling my shares in $BLK (-1,22 %) to sell:
These are close to the all-time high in dollars (which I generally don't think is a bad time to sell), but roughly about 10% lower in EUR. So selling would currently mean giving up about 10% of the return.
The share in my portfolio is 3.5%, I would currently realize a profit of 13% in EUR.
My investment horizon is 15 years+, my US share in the portfolio is approx. 80-85%.
How are you dealing with the current weakness of the dollar? Does it even make sense to react by buying/selling?
Are you currently selling positions in dollars because of the weakness of the dollar (and accepting the loss of return in EUR)?
Or is that precisely why you are not selling, even though you actually want to sell?
Or are you perhaps even building up positions in dollars in order to benefit from an appreciation of the dollar from 2027?
Investing in times of a falling USD
What is it about?
As I wrote in my last post, the USDEUR exchange rate has broken its upward trend, which has been running since 2007, in the last few days.
Why is this a problem for investors?
A falling USD means capital outflows from the US market, which traditionally goes hand in hand with problems in the US and global economy and thus falling equity indices. In addition, a 30% depreciation of the USD means an additional 30% loss for investors in EUR. Ergo: Understanding the USD cycle is very important for your own investment strategy!
In the following article, I will 1. introduce you to the USD cycle, 2. explain which asset classes perform best in which phase of the cycle, 3. what to expect over the next few years from a cycle perspective and 4. how to profit from it.
The USD cycle
Here is the long-term chart of the USD index since the installation of the current international monetary system (Bretton Woods) in 1971:
A certain cyclicality of the USD is noticeable. It can be roughly summarized as follows:
High approx. 120 USD: 1971
Low approx. 80 USD: 1978-80 -30%
High approx. 160 USD: 1985 +100%
Low approx. 80 USD: 1990-95 -50%
High approx. 120 USD: 2000-02 +50%
Low approx. USD 70: 2007-11 -40%
High approx. 115: 2022-2025 +60%
If you look at the highs in 1969, 1985, 2001 and 2017, you can see a relatively stable 16-year cycle. The next high point would be around 2033. There is also a 16-year cycle for the low points: 1978, 1994, 2010. The next one would be around 2026. Roughly speaking, this results in the following cycle: USD falls for 9 years and then rises for 7 years. On average, the USD appreciates by 70% in an upward cycle and depreciates by 40% in a downward cycle (100 +70% -40% = 102). The economic reason for this cycle is probably to be found in the US election periods and the different economic policies.
Each cycle tells its own story:
1969-1978: Oil crisis and stagflation
1979-1984: Reaganomics
1985-1994: Political turnaround and emerging markets boom
1995-2000: Internet boom and emerging markets bust
2001-2010: Internet bust, financial crisis and emerging markets boom
2011-2016: Zero interest rate policy and US tech boom
2017-2026: AI boom/bust and Trump(?)
What does this mean for the next few years? The current phase did not look like a devaluation phase for a long time. We are still only 10% below the peak of the last appreciation phase 2011-16/17. The current depreciation phase ends in 2026/27. For the cycle of the last 60 years to be maintained, there would have to be a significant USD depreciation of 30-40% in the next 1-2 years.
Ergo: If the cycle remains intact, we are on the verge of a true USD crash! Of course, it will hit everyone unexpectedly, especially our political economists - but not you! You now know the cyclicality. How can you profit from it now?
2. the performance of asset classes in the cycle phases
Here you can see the real return (performance minus inflation) of the most important markets S&P500, emerging markets, gold and commodities in the individual phases of the cycle in USD (I have left out bonds):
S&P 500
Period Real (p.a.)
1969-1978 -0,5 %
1979-1984 4,4 %
1985-1994 10,9 %
1995-2000 17,5 %
2001-2010 0,0 %
2011-2016 10,3 %
2017- 2025 7,5%
MSCI Emerging Markets Index
Period Real (p.a.)
1969-1978 -
1979-1984 -
1985-1994 12,0 %
1995-2000 2,0 %
2001-2010 9,4 %
2011-2016 -3,4 %
2017- 2025 2,1%
Gold (USD per ounce)
Period Real (p.a.)
1969-1978 23,8 %
1979-1984 2,5 %
1985-1994 -4,9 %
1995-2000 -5,5 %
2001-2010 14,7 %
2011-2016 -5,0 %
2017- 2025 9,2%
Commodities (CRB/BBG Commodity Index)
Period Real (p.a.)
1969-1978 5,0 %
1979-1984 -2,1 %
1985-1994 -4,2 %
1995-2000 -0,4 %
2001-2010 5,0 %
2011-2016 -10,4 %
2017- 2025 -0.7%
If we select the top performer for each period, the following picture emerges:
Period 1st place (real return p.a.)
1969-1978 Gold +23.8 %
1979-1984 S&P 500 +4.4 %
1985-1994 EM +12.0 %
1995-2000 S&P 500 +17.5 %
2001-2010 gold +14.7
2011-2016 S&P 500 +10.3 %
(2017-2025 gold +9.2 %)
The result is quite clear: the S&P 500 performs best in the USD appreciation phases. Gold and, to a lesser extent, emerging markets perform best in depreciation phases. There is also an economic logic to this: when the US economy is booming, international capital flows into the US market, which strengthens the USD and causes prices to rise. Gold is traded in USD and becomes cheaper for ex-US investors when the USD falls and more attractive for US investors when share prices fall. Emerging market companies and governments are often indebted in USD, which lowers the debt burden when the USD falls.
3. cyclical forecast for 2026/27
a) The USD is likely to reach its cyclical low in 2026. As it is still close to the high of the last cycle, it should depreciate by approx. 30-40% over the next 1-2 years.
b) The S&P500 has gained an average of approx. 3.5%pa (real) during the devaluation phases. From a level of 2400 points in 2017, this would be approx. 4500 points at the end of 2026 with approx. 3% inflation, i.e. approx. 15% lower than today (5300 points).
c) Gold has gained an average of approx. 11.2%pa (real) during the devaluation phases. From a level of USD 1300 in 2017, 3% inflation at the end of 2026 results in a gold price of approx. USD 4900, i.e. around 50% higher than today (USD 3300).
d) For euro investors, the depreciation of the USD must also be taken into account. This means that an unhedged S&P500 ETF would be approx. 45-55% lower in 2026 than today according to the cycle and unhedged gold would be approx. 10-20% higher than today.
e) From 2027, the USD should bottom out and then rise again until 2032. This would then also be the performance phase for the S&P500.
4. strategies and investments
a) Passive B&H savings plan investors (S&P500/ MSCI World/ ACWI)
B&H investors remain consistently invested and continue to save in their ETFs. However, they should be prepared for a massive test of their strategy and nerves. The drawdown could be massive (approx. -50%) due to the falling USD and falling equity markets. Those who have added emerging markets should be less affected by a falling USD.
Those who have the opportunity can consider at least hedging the depreciation of the USD. A factor certificate or ETC is most suitable for this. If you reserve 10% of your portfolio volume for a factor 10 short USDEUR, you can at least cushion a good part of the USD depreciation.
- Wisdomtree 5x Short USD EUR ETC, DE000A12Z322
- Vontobel 10x Factor Warrant EUR long USD, DE000VP3NYZ9
An alternative would be to pause the savings plan for the equity ETF and instead invest in a currency-hedged gold ETC or simply a money market ETF.
- WisdomTree Physical Gold - EUR Daily Hedged, JE00B8DFY052
Another option is to switch to currency-hedged ETFs or redirect the savings plan to them. Such ETFs are available cheaply for the S&P500, MSCI World and ACWI.
- Invesco S&P 500 EUR Hedged UCITS ETF IE00BRKWGL70
- iShares Core MSCI World UCITS ETF EUR Hedged (Dist), IE00BKBF6H24
- SPDR MSCI All Country World UCITS ETF EUR Hedged (Acc) IE00BF1B7389
b) Active investors (market timing, trading, stock picking)
Friends of sophisticated, strategic market timing have a few more options.
They can either switch immediately into a currency-hedged gold ETC or wait for a correction and invest in gold near the SMA100 via a factor ETC, for example.
- WisdomTree Physical Gold - EUR Daily Hedged, JE00B8DFY052
- WisdomTree Gold 2x Daily Leveraged JE00B2NFTL95
Or you can bet directly on a falling USD with a low-cost factor ETC/certificate (see above)
In addition to gold mines, equity fans can also target emerging market companies with high USD debt, as these benefit particularly from a falling USD. This can quickly add up to several 100% gains.
Finally, connoisseurs can bet on falling prices on the US markets with inverse index ETFs. However, due to the asymmetrical volatility, a good strategy and disciplined implementation are a must here.
- Amundi MSCI USA Daily (-1x) Inverse UCITS ETF Acc LU1327051279
What other ideas do you have for profiting from a USD devaluation?
5. summary
The USD cycle has been very reliable over the last 60 years. Knowing it helps to better understand the major movements in the financial markets. The current break in the USD trend could be followed by a rapid and sharp depreciation of the USD in the next 1-2 years with serious consequences for the financial markets, especially for German investors with USD investments. Those who know the cycle can protect themselves against it or even profit from it.
I have hereby warned you.
And now on with the business!
Your Epi


1. Depreciation of the USD
2. Risk of US economy underperforming peers
The first is more or less a given fact, most large institutions estimate the USD/EUR to reach 1.20-1.30 within a year due to decreasing belief in the stability of the US. Medium-term, stocks would have to overcome this 3-12% return just to overcome USD devaluation. Hence, I'm more reluctant to buy USD stocks, esspecially the more stable ones / those least likely to outpace this devaluation.
The second factor is more difficult to assess as economic signals are as mixed as mr. Oranges decisions. If these would start to point more towards recession, I'd adapt my stock picks for this (e.g. pick healthcare or staples over US-based tech)
In general, I think this topic is too often neglected, curious to here the thoughts of others.
Titres populaires
Meilleurs créateurs cette semaine