About an hour ago, I read a great article on my broker’s website here in Denmark (Saxo Bank), which I don’t want to keep from you, since I think it addresses an issue that many people may not be aware of.
Key Takeaways
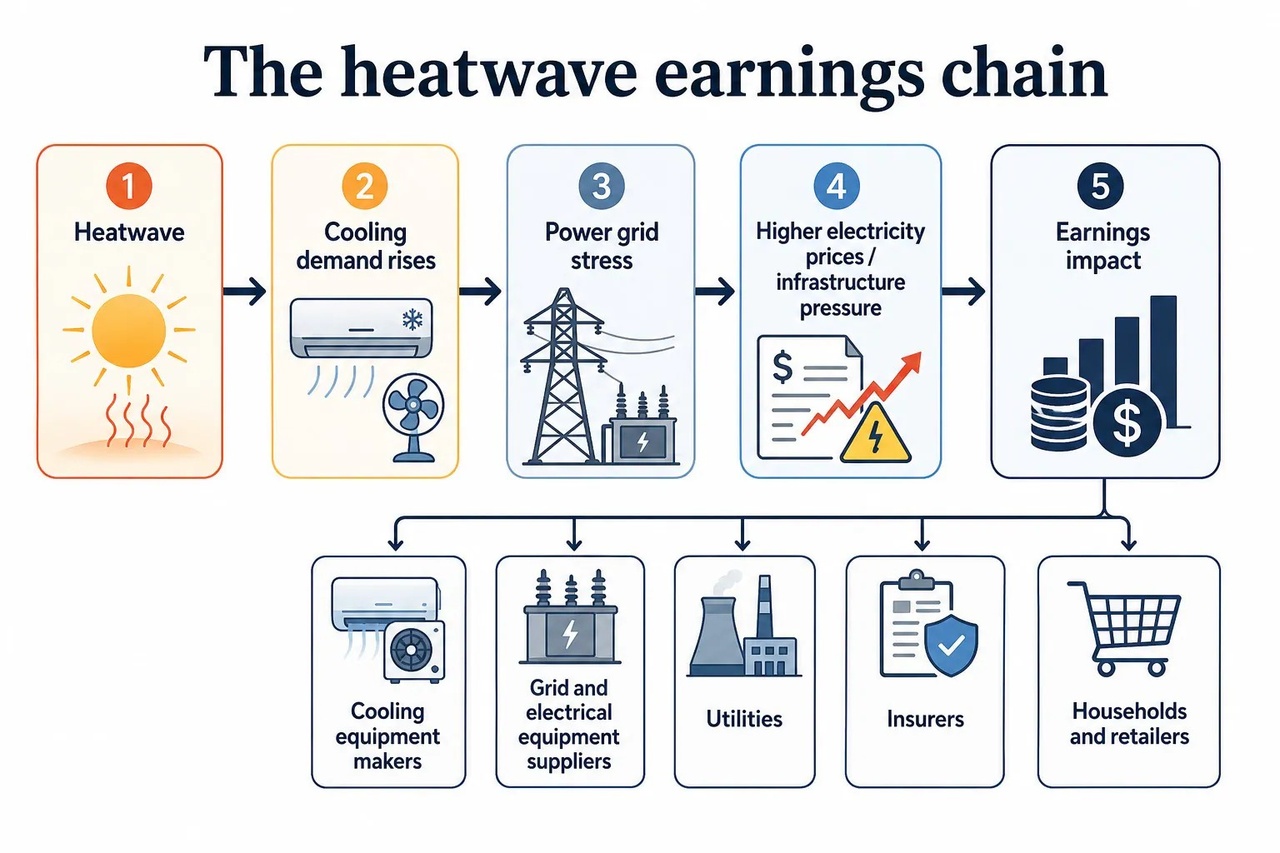
- Europe’s heat wave is driving up demand for cooling and putting power grids to the test.
- The winners could include appliance manufacturers, grid equipment suppliers, and select utility companies.
- The risks lie in electricity prices, insurance claims, and the financial strain on households.
In late June 2026, Western Europe faced record-breaking heat, with countries such as France, Spain, Italy, and the United Kingdom under strain. Schools closed, traffic slowed, power systems were overloaded, and consumers rushed out to buy fans and air conditioners. Out on the streets, it’s simply unbearable. In the markets, this creates a simple chain of events: heat increases the need for cooling, cooling increases electricity consumption, electricity demand strains the grids, and grid strain alters earnings expectations.
For investors, it’s not about trading the thermometer. That’s a very small desk with a very hot seat. The point is to understand how extreme weather can translate from the weather map into revenue, costs, margins, and insurance losses.
The first winner is the power outlet The most obvious heat wave trade starts with cooling. Daikin $6367 (+2,03 %) , Samsung Electronics $005930 and LG Electronics $066570 are clear examples. Daikin is a Japanese specialist in heating, ventilation, and air conditioning (HVAC). Samsung and LG are South Korean electronics conglomerates with large divisions dedicated to home appliances. When European households realize that a south-facing apartment can turn into a small oven, demand for cooling products rises rapidly.
That doesn’t mean every summer heat wave will lead to a sustained profit boom. Portable air conditioners are often low-margin products. Supply chains can become overburdened. End-consumer demand may wane when the weather changes. But the overall trend is hard to ignore. In the past, Europe has had a lower penetration rate of air conditioning compared to many warmer regions. As hot summers become more frequent, cooling could shift from a luxury purchase to a basic comfort product.
This also explains the building perspective. Legrand $LR (+1,29 %) manufactures electrical and digital building infrastructure. Assa Abloy $ASSA B (+0,88 %) manufactures locks, doors, and access systems. Kingspan produces insulation and building materials.
These companies are not purely “heat wave plays.” They are tied to the deeper question: How can buildings become more livable, efficient, and resilient?
A good building needs more than just a larger air conditioning system. It needs better insulation, smarter wiring, efficient controls, shading, doors, ventilation, and energy management. Otherwise, Europe risks solving the heat problem by creating an electricity bill problem. Very elegant—much like fixing a leaky roof by simply buying more buckets.
The grid is becoming a bottleneck
The second part of the story is electricity. Schneider Electric $SU (+9,45 %) and Siemens Energy $ENR (+9,76 %) are right at the center of this pressure point. Schneider Electric sells equipment for energy management, automation, and energy efficiency. Siemens Energy supplies grid technology, turbines, and energy infrastructure. When power grids are confronted with higher peak loads, more renewable energy, increasing electrification, and higher cooling demand, the value of grid investments is easier to justify.
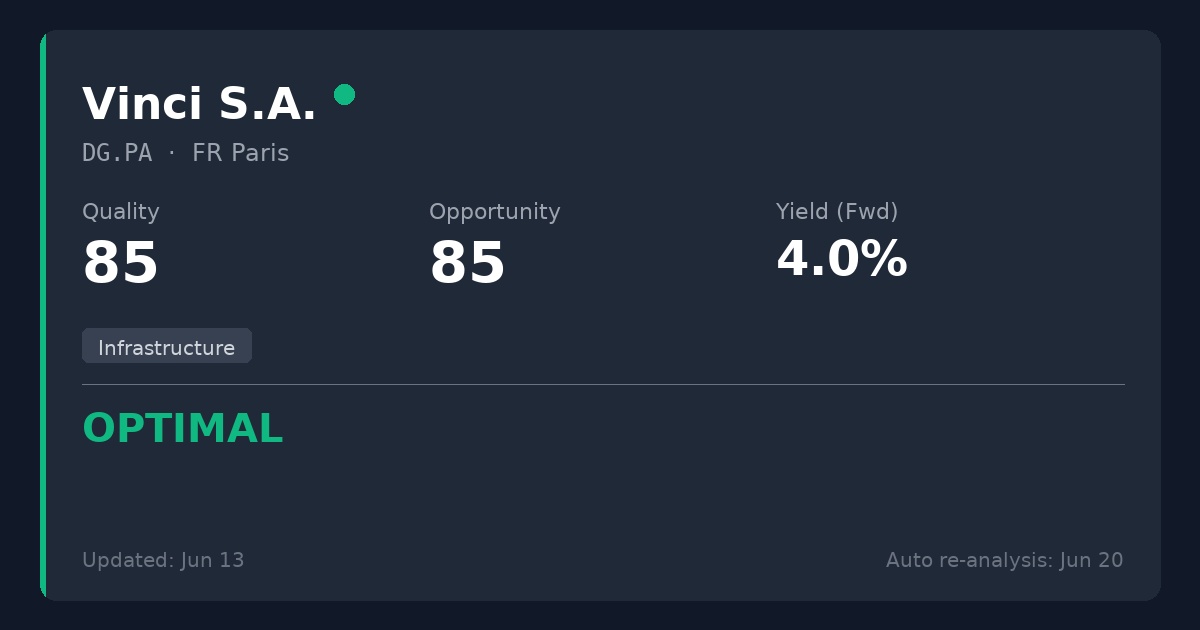
For utilities, the picture is more mixed. E.ON $EOAN (+1,72 %) and National Grid $NG. (-0,14 %) are primarily grid operators. They earn their revenue mainly through the ownership and operation of regulated electricity and gas infrastructure. Heat waves can increase investment needs, as the grids must cope with higher peak loads, localized strains, and more complex power flows. For regulated utilities, the long-term opportunity lies in the fact that investments in resilient grids can support future asset growth. Those boring power lines suddenly take center stage.
RWE $RWE (+1,47 %) , Enel $ENEL (+1,17 %) and Iberdrola $IBE (-0,39 %) have greater exposure to power generation. They own power plants and renewable energy facilities. High electricity prices can bolster the revenues of some generators, especially when supply is tight.
But heat can also be harmful. Nuclear power plants may have to curtail their output if river water becomes too warm for cooling. Low wind speeds can reduce renewable production. Droughts can impact hydropower. Gas-fired power plants can become the marginal source, meaning they dictate the price when demand is high and cheaper supply is insufficient.
So heat waves don’t simply mean “utilities win.” The details are crucial. Grid operators could benefit from the investment cycle. Generators could benefit from higher prices during certain hours, but face operational risks during others. Retail utilities could run into trouble if customers are hit with high bills and political pressure mounts. The weather may be hot, but the analysis must remain cool.
Insurance Companies Will Foot the Bill Later
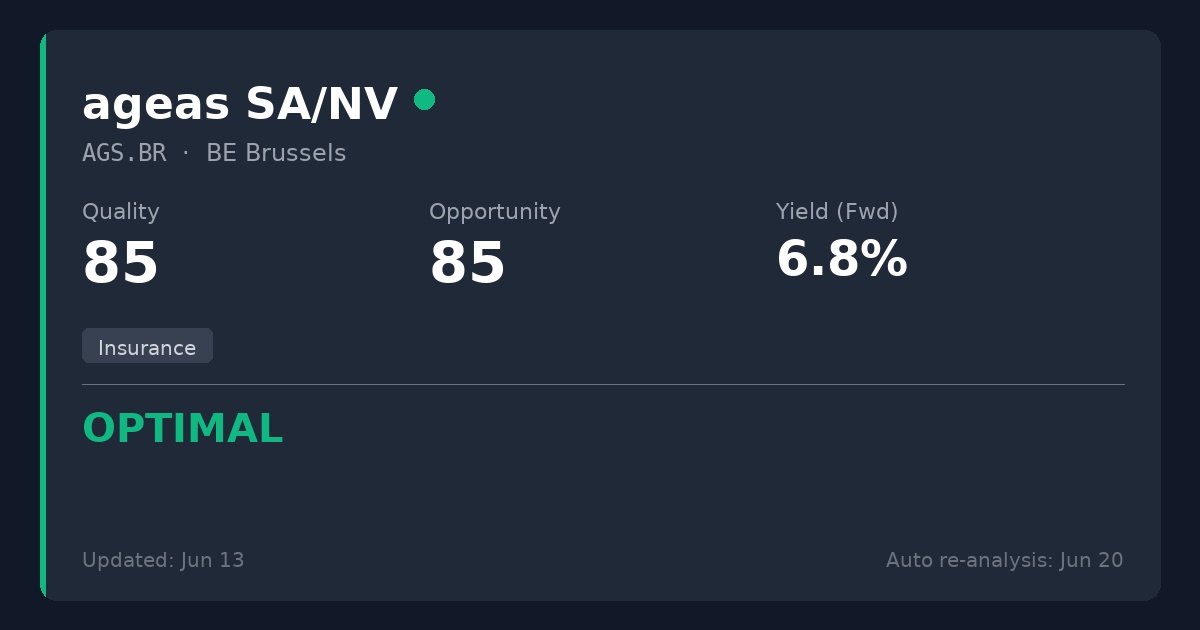
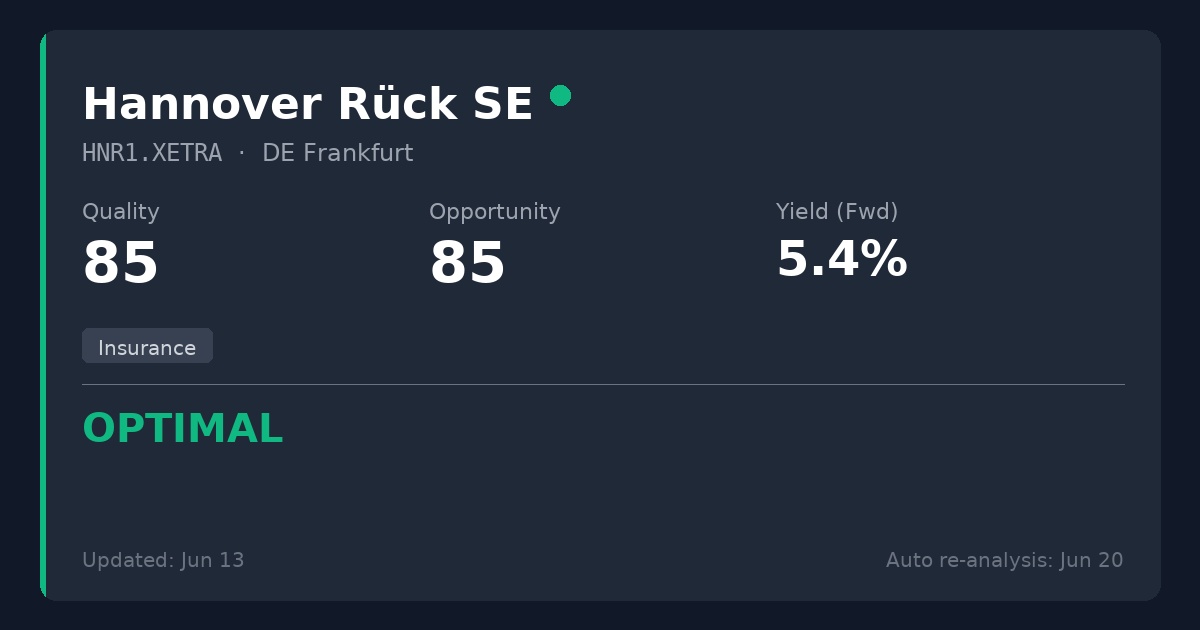
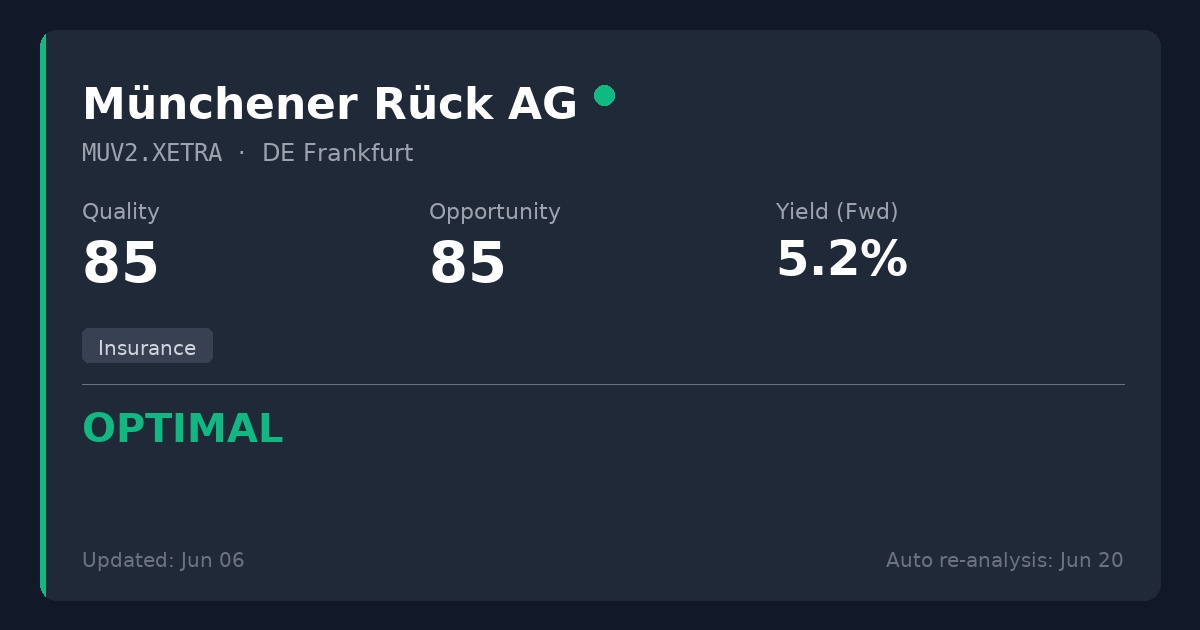
The third level involves insurance companies. Munich Re $MUV2 (+0,29 %) and Swiss Re $SREN (+1,1 %) are reinsurers. Reinsurers insure insurers—which sounds like financial plumbing, because that’s exactly what it is. They help spread major risks (storms, wildfires, floods) across the system.
Heat waves can affect insurers in various ways. They can increase risks in the areas of health, agriculture, and business interruption. They can heighten the risk of wildfires. They can also expose weaknesses in infrastructure. For reinsurers, this can mean higher claims payouts in some years, but in the long run, it also leads to higher prices as risks become more visible and insurance buyers accept higher premiums.
That’s the strange logic of insurance: Bad weather hurts in the short term, but it supports better pricing later on. The umbrella industry doesn’t like storms, but storms remind everyone why umbrellas cost money.
Risks to Keep an Eye On
- Investors might overreact to a hot summer.
- Political risks: High electricity prices can trigger government intervention (excess profit taxes).
- Cost risks: Grid expansions, cooling equipment, insulation, and insurance all cost money. Customers might push back if household budgets are already stretched thin.
The Bottom Line Under the Sun
The “heat wave trade” isn’t about guessing next week’s temperature. It’s about recognizing where resilience translates into revenue, where strain leads to costs, and where the old European assumption of mild summers is no longer a reliable forecast. In the markets, just as in homes in July, heat is rarely dispelled simply by ignoring it.
Source: Saxo Bank / Saxo Trader – Ruben Dalfovo, Investment Strategist
@Dividendenopi
@Aktienhauptmeister
@Multibagger
@Tenbagger2024
@Get_Rich_or_Die_Tryin
@Stocktective
@Simpson
@WarrenamBuffet
@SAUgut777
@TradingHase
@PikaPika0105
@Derspekulant1
@NichtRelevant
@Klein-Anleger
@Dividendenopi
and, of course, everyone else :)