Lotus Bakeries
Price
Discussion sur LOTB
Postes
21Come on, put put put.... kommmm ☺️
$LOTB (+0,17 %) but the 6k or less please only from 2.5. 😏 have money again there
🎉🍾🙌👏
$LOTB (+0,17 %) finally under 8,000 euros 😏 get further down to 6,000 euros 😈
Lotus Bakeries 🍪 - Share presentation
Brief presentation of the company
- ISIN / Ticker: BE0003604155 $LOTB (+0,17 %)
- Sector / Industry: Consumer Staples - Food & Snacks
- Geographical positioning: Lotus sells its products in over 70 countries worldwide, with a growing presence in North America, Europe and Asia.
Brief profile & business model
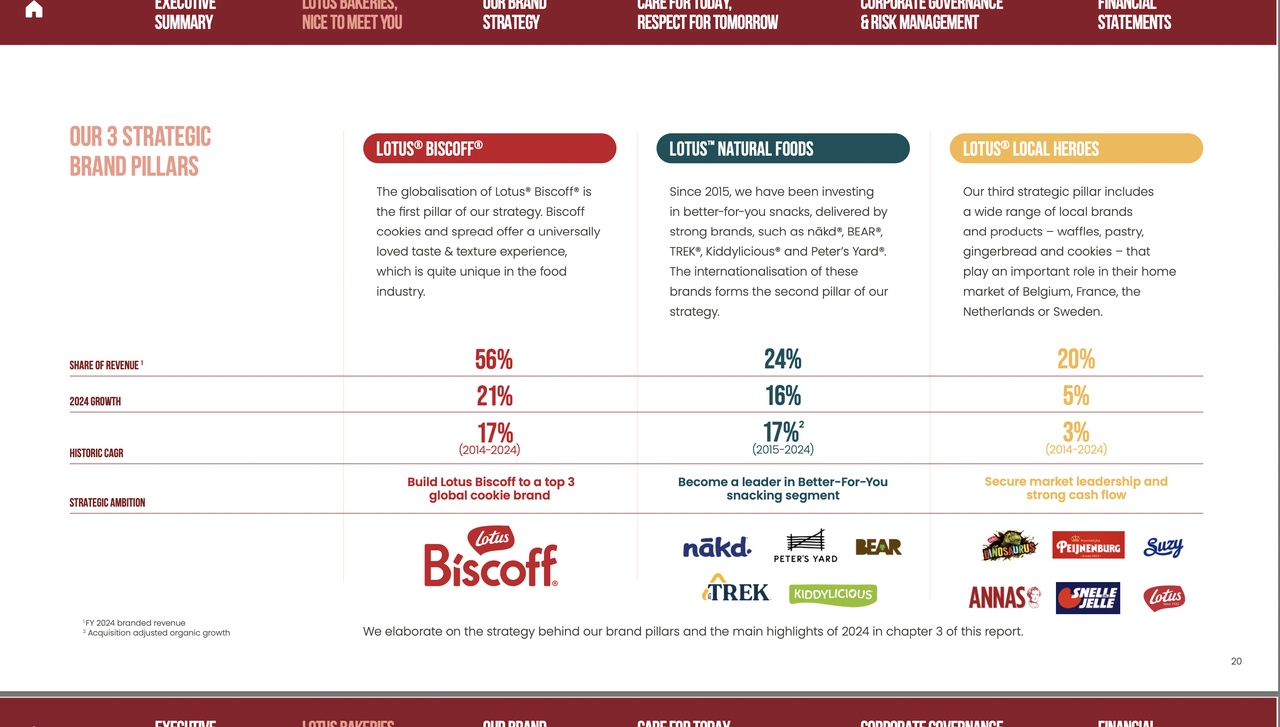
Lotus Bakeries is a Belgian family business headquartered in Lembeke. The company is particularly well known for its iconic caramel cookie "Biscoff", which has been established worldwide as a coffee biscuit. In addition to the core brand, Lotus is continuously expanding into healthy snacking with brands such as BEAR, Nakd, TREK and Kiddylicious.
The company pursues a growth-oriented brand strategy combined with a strong international distribution network. The aim is to gain market share through innovation, premium branding and organic and inorganic growth.
Fundamental key figures
- Market capitalization: € 6.7 billion
- P/E ratio / forward P/E ratio: 43 / 49
- Sales growth: 14
- Profit growth: 13
- Net profit margin: 12
- Dividend yield: 0.7
Valuation
Lotus is currently valued at a high multiple. Compared to other snack and confectionery manufacturers (e.g. Kellanova, Hershey, Nestle), Lotus shows above-average growth combined with high profitability.
Opportunities & risks
Opportunities:
- Strong brand: Biscoff is globally established and has high pricing potential.
- Growth market "healthy snacking": acquisition and development of innovative brands.
- Internationalization: North America and Asia in particular offer further potential.
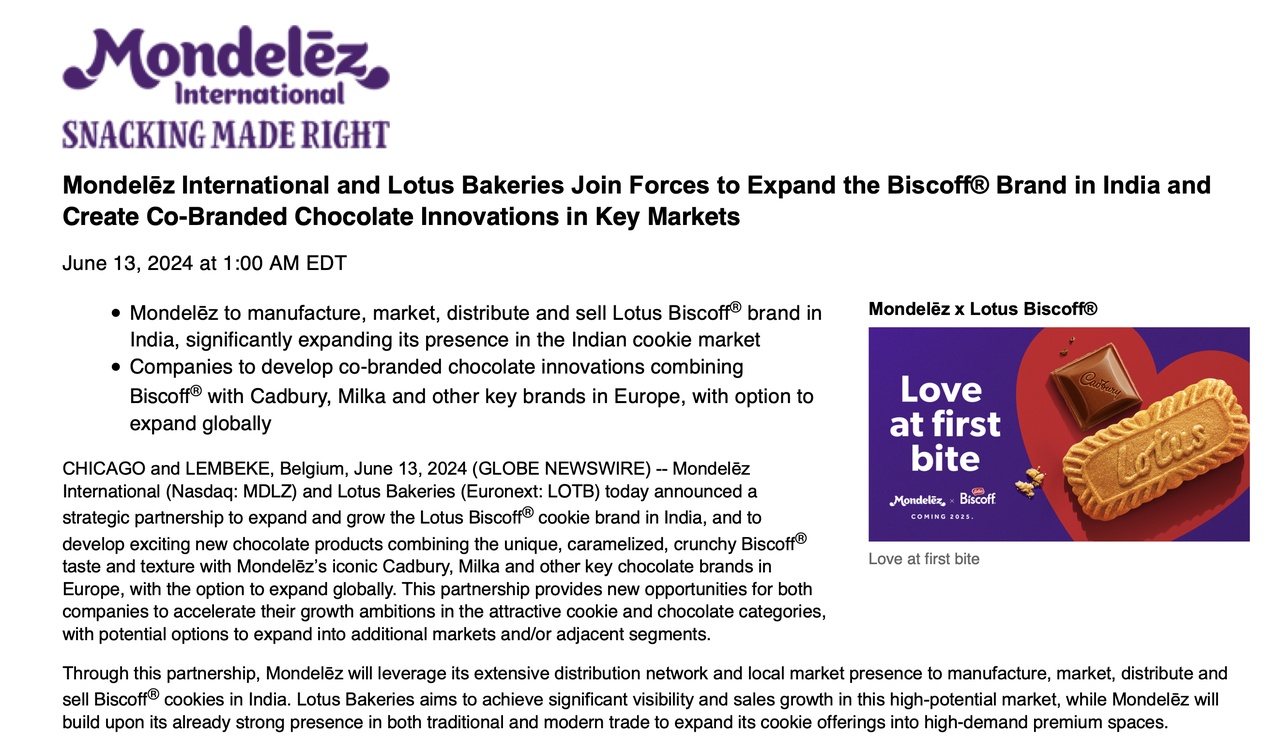
Partnership with Mondelez for marketing in India
- Solid balance sheet: Hardly any debt, high return on equity, strong management.
Risks:
- High valuation: With a forward P/E ratio of 38, Lotus is ambitiously valued.
- Rising labor and material costs
- Concentration on a few brands: Biscoff accounts for a large proportion of sales.
Chart technique
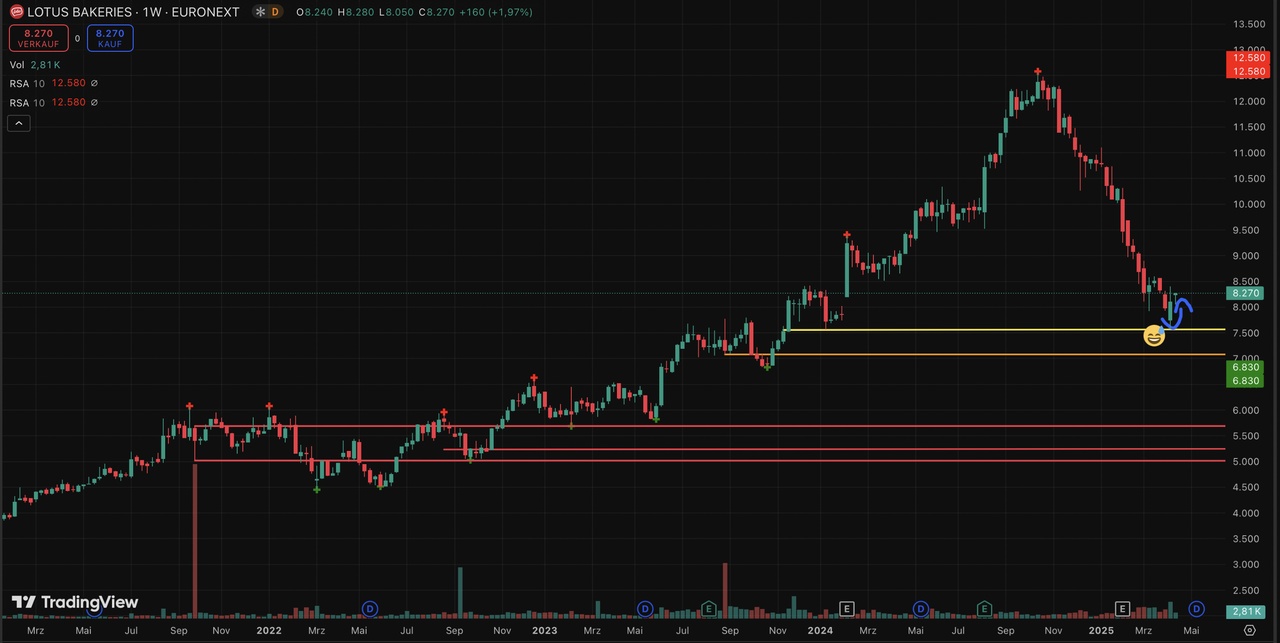
The Lotus share is currently in an impulsive downward trend and has lost approx. 34% since the ATH without resistance.
From a technical point of view, things remain exciting. Although the share has bounced off the resistance marked in yellow for the time being and is even showing the first signs of consolidation in the short term, the volume is weak and the relevant resistance levels are significantly lower.
Conclusion on the chart:
Patience is required, wait for a bottom to form.
I am still going in with a savings plan as I am extremely impatient 🫣
Possible entry range: EUR 5,500-6,000
Personal assessment
Lotus Bakeries remains a quality stock with a strong market position, international expansion and high profitability. The valuation is quite high, but reflects the high pace of growth. For long-term investors with a focus on quality and brand management, this may be an attractive entry opportunity.
Sources:
https://www.lotusbakeries.com/investors
https://ir.mondelezinternational.com/node/28841/pdf
finchat.io
+ 2
My favorites in the consumer staples sector 🛒🧻
General Mills $GIS (-1,17 %) (fair-favorable, interesting)
Wal-Mart de Mexico $WALMEX* (+0 %) (downtrend - weak peso?)
P&G $PG (+0,31 %)
Costco $COST (-0,72 %)
Church & Dwight $CHD (-0,93 %) (very expensive - silent expansion underway? see German website)
Pepsi $PEP (-1,21 %)
Monster $MNST (-2,23 %)
Coca Consol $COKE (+4,24 %)
Lotus Bakeries $LOTB (+0,17 %)
Mondelez $MDLZ (-1,08 %)
Hershey $HSY (-0,02 %)
Most of them are still "very" expensive in my opinion, despite the current price declines.
I would be interested to know which are your favorites for a long-term investment?
🧘♂️ Patience should be a virtue 🤪
$LOTB (+0,17 %) Hmmm...I'm still holding off on buying it. Here are my thoughts on the 🍪 (feel free to correct, other opinions can only enrich):
Why am I still waiting? Because I (technically) think that the share will go down to around €8,000 in the next few days and then (the zone will most likely not hold) slide towards €7,410...then the dividends will come and the 🍪 will slide even lower and sometime towards July/August it may head north...until then 👀🧘♂️ and check if the "signs of a bottoming out" appear...so far I'm still a little skeptical.
So first go to the store and buy 🍪☕ and 🧘♂️ohmmmmm.
What do you think? 🫶
Reduce US share in portfolio?!
The year to date shows that excessive dependency harbors risks. Increasing political uncertainty and high valuations are prompting many investors to look for alternatives. Europe and Asia offer exciting companies that are often valued more favorably and have great long-term potential.
Strong European alternatives for your portfolio:
Adyen $ADYEN (+0,03 %) is a leading payment service provider that is benefiting from increasing digitalization. After a difficult year, the company could get back on track.
Schneider Electric $SU (-0,06 %) from France is a key player in energy and automation technology and is benefiting from electrification and the growing focus on sustainability.
Novo Nordisk $NOVO B (-3,79 %) a classic and dominates the market for diabetes and obesity medication. The strong demand for Wegovy and Co. ensures continuous growth.
ASML $ASML (-0,49 %) is indispensable for the chip industry. Without ASML's machines, there would be no modern semiconductors. A real growth stock for the future.
Lotus Bakeries $LOTB (+0,17 %) is growing worldwide with its popular Biscoff cookies. The expansion into new markets makes the company exciting for long-term investors. More on this in one of my last posts.
Exciting stocks from Asia:
Tokyo Electron $8035 (+0 %) is one of the most important suppliers to the semiconductor industry and is benefiting from the global chip boom.
Alibaba $9988 (+2,37 %) remains an e-commerce and cloud giant with long-term potential despite regulatory challenges.
Fast Retailing $9983 (+0,41 %) (Uniqlo) is growing strongly in Asia and could establish itself as a global fashion brand.
The MSCI World ex USA as an alternative for passive investors:
If you want to reduce your US share but do not want to invest in individual stocks, you can use an ETF on the MSCI World ex USA as an alternative. Regular purchases via a savings plan can gradually dilute the US share in the portfolio.
What is your current US share? Are you planning to reallocate or are you still heavily invested in the USA?
Lotus Bakeries Bottom formation
The Lotus Bakeries share (Euronext: $LOTB (+0,17 %) ) recorded a record high of around € 12,580 in October 2024. The share price then entered a strong downward trend. By mid-March 2025, the share price had fallen to around € 7,920 - a decline of around 35-40 % from its high. This meant that almost all of the gains made in 2024 were lost again. By way of comparison: in 2024, the share reached a low of € ~7,690 (early 2024) and still ended the year with a +30 % annual performance, while in 2025 it has trended significantly weaker so far (approx. -21 % YTD to March). This development shows a clear change in trend: from October 2024, a downward trend dominated, which was only temporarily halted in March 2025.
Fig.: Daily chart of the Lotus Bakeries share (Oct. 2024-March 2025). The sustained downward trend from the high in October (near € 12,500) to the low in March (near € 8,000) is clearly visible, as are the falling moving averages (blue = 50-day, red = 200-day).
Support levels and chart patterns
The price slide may have bottomed out in the € 7,900-8,000 range in March 2025. This area corresponds to an important support zone, as a low was already marked here in early 2024 (approx. € 7,690). A double bottom is therefore emerging in the longer term, provided the zone around € 7,7k-8k holds. In fact, the price turned upwards again on March 11, 2025 at ~€7,900 . In addition, there is technical support at ~€8,430 due to high trading volumes, which could trigger increased buying.
At the same time, the share has been moving within a falling trend channel since fall 2024. The downward trend line currently runs at around € 8,600-8,700. A breakout above ~€ 8,600 would be an initial signal that the downward trend is losing momentum and a trend reversal could be in the offing . So far, however, the price has remained below this level, which means that the overarching downtrend is formally intact. In the short term, a recovery movement has established itself after the March low; whether this becomes a sustainable upward trend remains to be seen at the resistance levels.
Important resistances are now above:
- approx. € 8,600 - upper trend channel boundary / first signal marker for trend reversal
- approx. € 9,000 - area of the long-term moving average, which can now act as resistance. The 100-day and 200-day lines were recently located here.
Technical indicators (RSI, MACD, moving averages)
The sharp price losses led the RSI (relative strength index) to oversold levels. In mid-March, the RSI only reached around 30 or 0.3 (in the normalized system) according to technical indicators - a level that indicates an oversold market situation. Such low RSI readings often indicate that a bottom may be near, as the selling pressure is exaggerated. In the days following the low, the RSI rose back out of oversold territory, underpinning the recovery.
The MACD (Moving Average Convergence Divergence) is also starting to indicate a possible trend reversal. After the March low, there was a bullish MACD crossover: according to the analysis, a pivot bottom (reversal point) was recognized on 11 March and a buy signal was generated by the MACD. This signals that the downward momentum is decreasing. In addition, the price itself confirms the turning point with a rise of around +7 % since the low. However, it should be noted that the MACD histogram could still be in negative territory overall - the final confirmation would come with a sustained rise in the MACD above the zero line.
Looking at the moving averages, the picture is mixed. As a result of the month-long price decline, the share price is trading well below the important average lines:
- Current price (~€8.4k) < 50-day moving average (~€9,500 estimated) < 200-day moving average (~€10,000+) . This constellation (short-term below long-term average) is referred to as a "death cross" and reflects an intact downward trend. As long as the share remains below these average lines, the overall trend is downwards.
- Nevertheless, the short-term moving average (e.g. 20-day line) turned slightly upwards as a result of the recent rally and provided an initial buy signal. This short-term GD runs around ~€8.3k and now offers support in the event of a pullback. The long-term average line (e.g. 100/200-day), on the other hand, is still above the price (~€8,968) and acts as resistance . Only a break above this long-term GD would generate a longer-term trend reversal signal .
Overall, the indicators confirm that although the first recovery signals are there (RSI sell-off, MACD cross, short-term GD as support), the overall trend signal technique has not yet clearly turned to "uptrend". There is therefore hope of a bottom, but this requires confirmation by further signals (e.g. a rise above the aforementioned resistances).
Fundamental influences on the price
Despite the focus on chart technology, fundamental news should also be taken into account, as it has had a significant influence on the technical situation. In the case of Lotus Bakeries, there have been some important company announcements in the last 6-12 months:
- Strong financial year 2024: Lotus Bakeries grew by +16% on the sales side in 2024 and recorded record sales . Successful products such as Lotus Biscoff contributed significantly to growth, and management planned expansion steps (e.g. new factory in Thailand by 2026) . In addition, the dividend was increased significantly - a sign of financial strength. These strong fundamentals actually underpin the company's long-term upward trend.
- High expectations and capacity limits: However, investors also had very high expectations of Lotus. The share was at times highly valued (P/E ratio over 50); due to the fall in the share price, the P/E ratio recently fell to around 29 - which shows that part of the correction is due to a valuation adjustment. When the annual figures for 2024 were announced, it became clear that Lotus was reaching the limits of its production capacity. Despite double-digit growth, forecasts had to be curbed: For 2025, management expects only ~10% volume growth for the time being, as no more can be produced . This news disappointed the market. As a result, the share price fell by around 5.7% in one day - the biggest daily loss in a long time . Analysts commented that although the results were solid, the growth limit at Biscoff had not met the high expectations. This fundamental event therefore reinforced the downward trend and led to a test of the aforementioned support zone.
- General market environment: The second half of 2024 and the beginning of 2025 were difficult for many growth stocks. Rising interest rates and general uncertainty led to profit-taking, particularly for stocks that had previously performed strongly. Lotus Bakeries was not spared. This partly explains the sharp correction from the all-time high - in addition to company-specific factors.
In terms of technical analysis, this means that The bottoming out was not only favored by chart factors, but also by the fading of negative news. As soon as the market has digested the capacity expansion plans (new plants) and the slightly lower growth, fundamental buyers could return. This would help to consolidate the technical bottom.
Conclusion: Has a bottom formed?
To summarize, the analysis shows signs that the Lotus Bakeries share could be forming a bottom in the €8,000 area. Support at this level has already held twice (early 2024 and March 2025) , and short-term indicators suggest a recovery (RSI out of oversold, MACD buy signal) . The high volume at the support level and the subsequent price increase of several percent also suggest that the downward momentum is easing.
However, the trend reversal has not yet been definitively confirmed. It will be important for the share to break above important resistances - in particular the downward trend line at ~€8.6k and later above the zone around €9k (long-term GD) . If this succeeds, it would provide a clearer bottom signal and could attract further buyers. Until then, there remains a residual risk that the recent recovery is merely a technical countermovement (bear market rally).
Investors should therefore keep a close eye on price developments in the coming weeks. Signs of a confirmation of the bottom formation would be, for example: sustained higher lows, rising turnover during price increases, breaking through the aforementioned resistance levels and an improvement in the indicators (MACD above zero, RSI stable above 50). At the same time, the share has reached a more attractive valuation level at the current level (P/E ratio ~29), which could have a fundamentally supportive effect.
Conclusion: The range around € 7.7-8.0k could represent the long-term bottom for the Lotus Bakeries share. The first technical signals of a trend reversal are recognizable, but a fully robust bottom formation still requires confirmation by an upward trend break. As long as this breakout does not occur, a certain degree of caution is advisable - but the chances of a trend reversal are much better than a few months ago, when the share was in free fall. In other words: the ingredients for a bottom are there; now the market has to bake an upward trend out of it. 🍪
Source: ChatGPT😊

🎉🍾🙌👏
$LOTB (+0,17 %) finally under 8,000 euros 😏 get further down to 6,000 euros 😈
And it goes on...
$LOTB (+0,17 %) Today we close the gap from Feb 2024 and then the correction will most likely head towards €7500🤔 If things continue like this, we can almost afford to pay 2 🍪🍪 for the price. It's been a few years since such a nice correction. Who's waiting with me here? 🧘♀️☕🍪
Lotus Bakeries with impressive growth and global expansion
In the year 2024, Lotus Bakeries generated $LOTB (+0,17 %) achieved a turnover of 1.23 billion euros, which corresponds to an increase of 15.9% compared to the previous year. Net profit rose by over 18% to around 152.58 million euros.
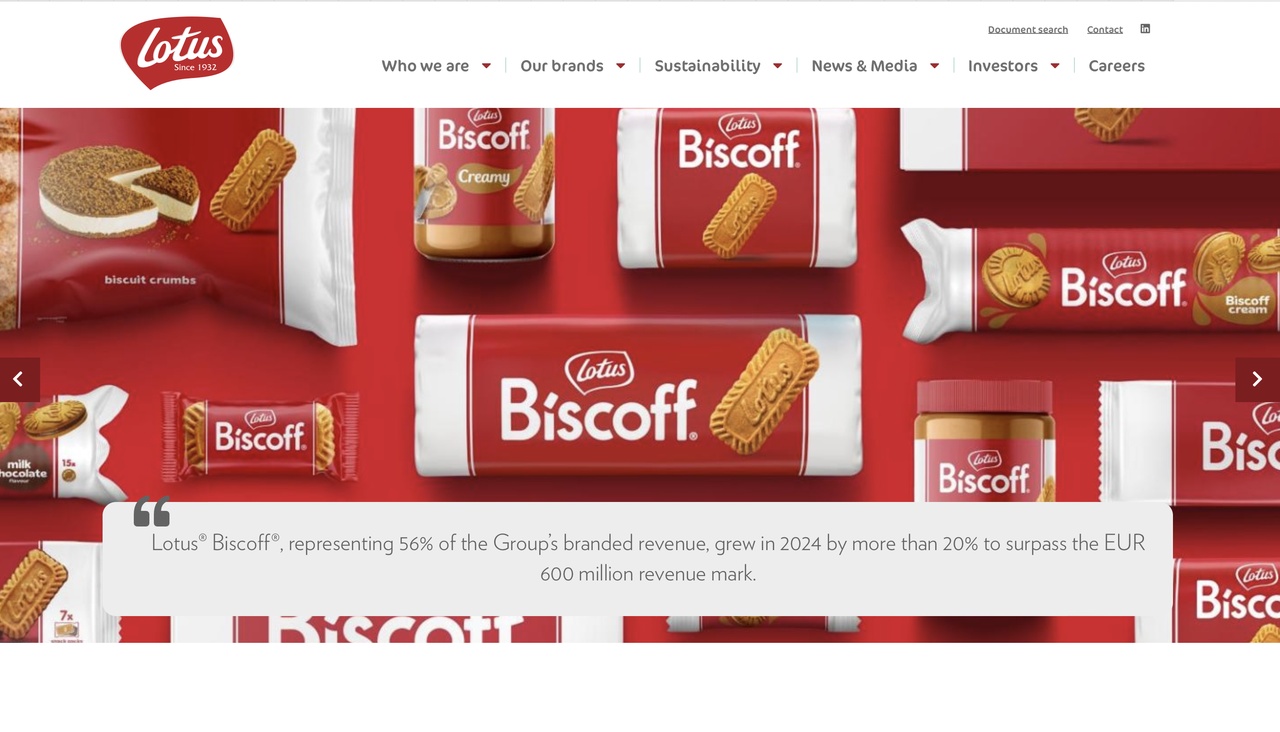
Particularly noteworthy is the performance of the Lotus Biscoff brand, which achieved sales of over 600 million euros for the first time.
To meet increasing demand, Lotus Bakeries is currently building a third production facility in Thailand, which is scheduled to be operational by 2026.
Lotus Bakeries' shares traditionally trade at a high valuation, but this also reflects the company's strong growth and market position. However, following the recent share price declines, the valuation is approaching a fairer level, which could make the share more interesting again for long-term investors. If the pace of growth continues, this could be an attractive entry opportunity.
Although I am not yet invested myself, I am keeping a close eye on future developments and can imagine making an initial investment in the near future.