1D·

MATT monthly review February 2026

The first month for MATT is already behind us. And a good one at that.

On February 13, we switched to the final universe. Since then there have been no signs of reallocation. The assets currently selected have a large momentum gap. With commodities, energy, gold and emerging markets, the portfolio is positioned "anti-crisis" and avoids industrialized countries completely. MATT has therefore adapted to the geopolitical situation.

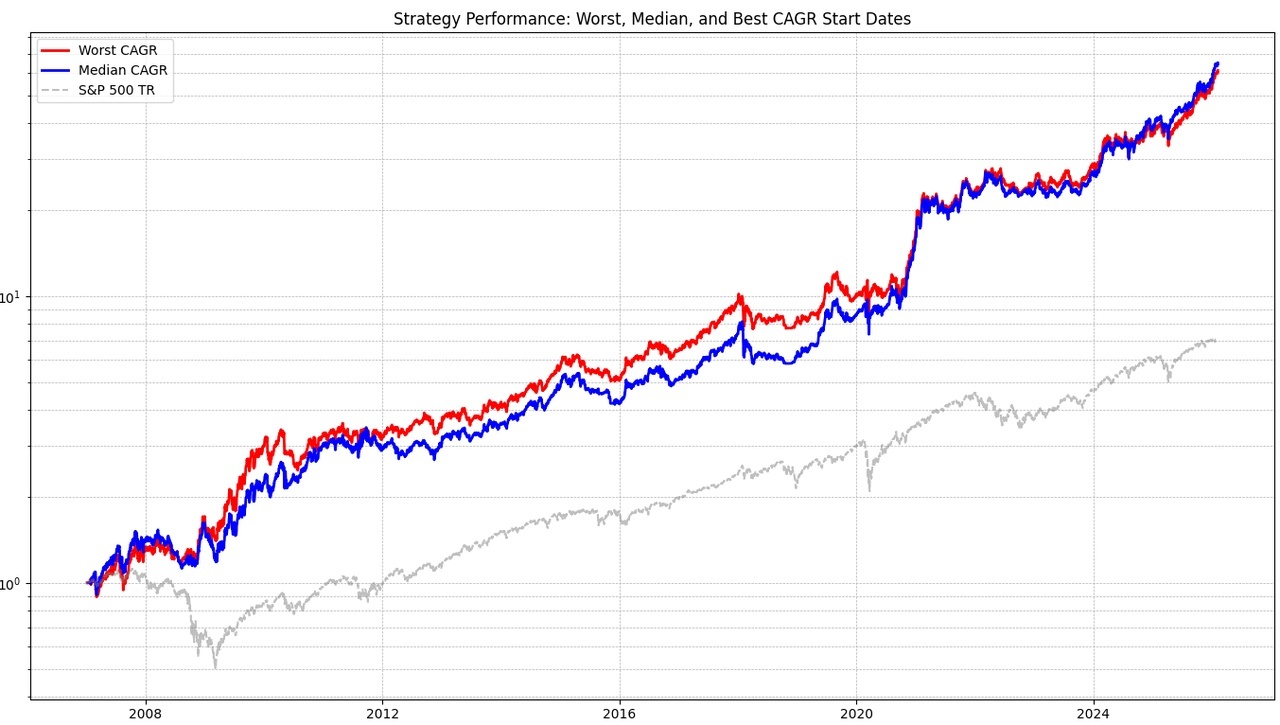
As expected, the momentum strategy is delivering slightly lower returns than 3xGTAA with fewer negative swings. The world index was clearly beaten.


MATT strategy: https://getqu.in/1zBXjL/

Wikifolio (investable from approx. mid-April): https://www.wikifolio.com/de/de/w/wf000matt0


Asset performance (in portfolio):

EM 3x | +15.7%

Gold 2x | +8.9%

Ex USA | +3.3%

Energy | +2.6%

Commodities | -0.6%

Gold 3x | -3.2%


Wikifolio certificate (total):

+8.72%


Comparative performance (Max DD per month):

🥇3xGTAA: +12.2% (-5.8%) (https://getqu.in/Zm0Z01/)

🥈MATT: +8.7% (-4.4%)

🥉Gold: +6.3% (-4.7%)

MSCI World: +1.1% (-0.7%)


Trading days:

13.02.

+ Gold 2x $LBUL (+4,71 %)

+ Energy $IXC (+2,98 %)

- World ex USA $EXUS (-0,96 %)

- Gold 3x $3LGO (+6,44 %)

27.02.

no changes


Allocation at the end of the month:

25% 2x gold $LBUL (+4,71 %)

25% energy $IXC (+2,98 %)

25% raw materials $XDBC (+1,07 %)

20% 3x EM $3EML (-3,61 %)

5% cash

previw image
16
14 Comentarios

Imagen de perfil
Exciting alternative to 3xGTAA and good performance so far! 👍

But one swallow doesn't make a summer. We'll see how it compares after a year.
5
Imagen de perfil
@Epi Yes, definitely. Even one year is probably not enough.
3
Imagen de perfil
@SemiGrowth I'm curious to see whether the sophistication of MATT or the simplicity of 3xGTAA will win out in the end.
1
Imagen de perfil
@Epi both can also work
1
Imagen de perfil
What do you mean by "slightly lower" returns? If I compare it with the 3GTAA over the last month, there is a 10% difference (MATT +0.1%, 3GTAA +12.3%)
Or am I missing something important?
Imagen de perfil
@Olli68 this is already the data from March. Epi has 2x oil there and that has now exploded. IXC and the commodities have not yet been able to react. We will see tomorrow
2
Imagen de perfil
@Olli68 $LOIL is already at €12.6 on Wikifolio
2
Imagen de perfil
@Olli68 You probably didn't take into account that Wikifolio also trades on weekends. This means that the start of the period is actually after the fall in gold
1
Imagen de perfil
Ok, sorry. It was my mistake. 🫣
Imagen de perfil
@SemiGrowth The +11% in February is still without Sat. We will see how the bill turns out at the end of Mon.
1
Imagen de perfil
@Epi Wikifolio has not provided any data for my portfolio as of February 28. I have now taken 27.02. as the date.
You wrote in your post that the data is from February 27th, but I just checked and your Wikifolio was at 199.19. So a little higher than you yourself stated. I'll have to raise your performance to 12.2% so that the comparison is fair. I simply copied your figures
2
Imagen de perfil
@SemiGrowth I used the ask price in the article. Wikifolio specifies the mid-price, but the performance fee is then also based on the ask price.
So it is better to stick to the ask price. 🤷
Imagen de perfil
@Epi I'm very curious, $XDBC also has oil and $IXC will certainly also benefit from the oil price. But of course you have the 2x leverage.
1
Imagen de perfil
@Epi okay, I used the mid price because I get it directly from the Wikifolio CSV download. I think there is only the mid price
1
Únase a la conversación