Traders in demand - double bottom trend reversal
Hello, to the traders/chart technicians out there.
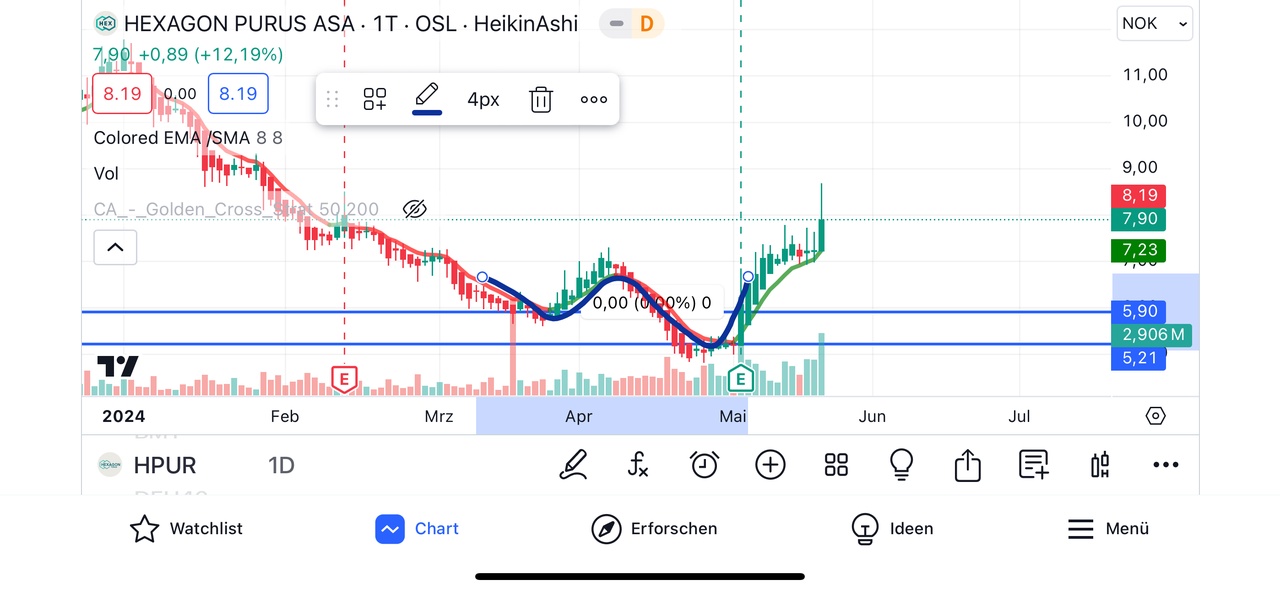
A quick question about the interpretation of a chart. Can you identify $HPUR (-7,34 %) a double bottom/ a "W" formation between March 22nd and May 2nd or is it not possible because the difference between the bottoms is too big?
For me it would be a slightly shifted "W".