1Semana·

3xGTAA – September 2026 Monthly Review

A golden autumn month is behind us. Here is the report:


Asset Performance 09/26 (August 31–September 30, according to Wikifolio)

3xQQQ: +12.4%

2xWTI: +28.7%

1xBTC: +11.1%


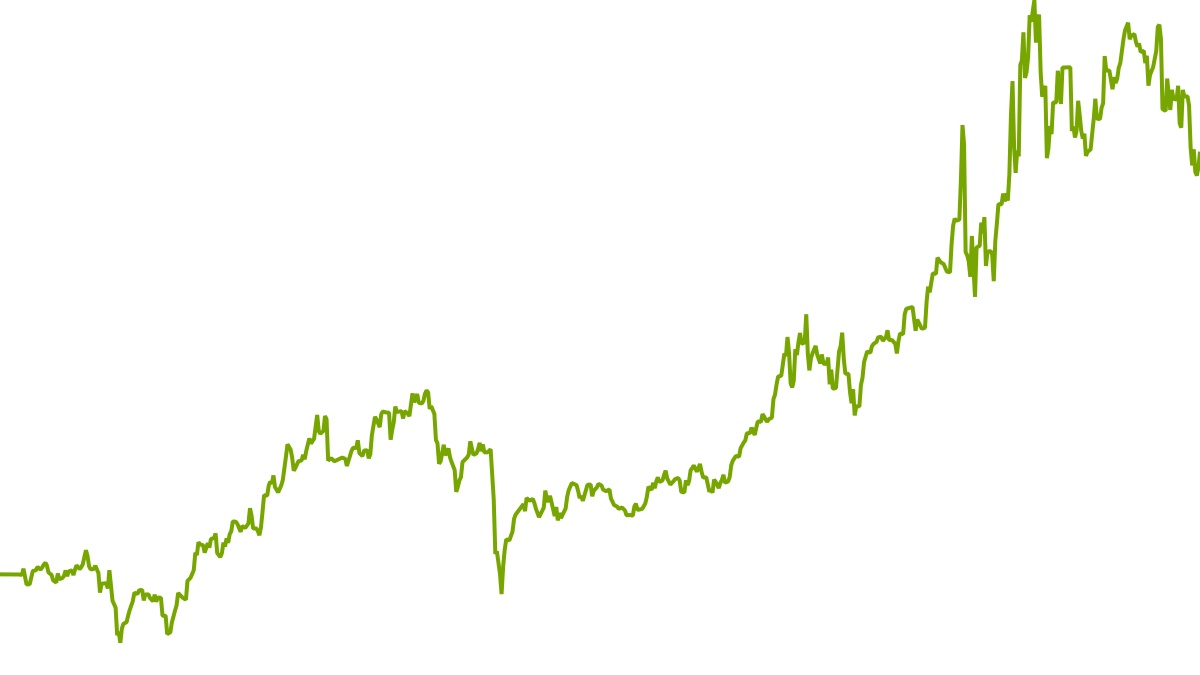
3xGTAA Portfolio (Sept. 30, according to Getquin)

Aug. 31, 26: €127,700

Sept. 30, 26: €144,900


Wikifolio Certificate (Oct. 30, according to Wikifolio)

Aug. 31, 2026: €198.60

Sept. 30, 2026: €225.35


Month: +12.4%

YTD: +38.5%


Review 09/26


With a gain of +12.4%, 3xGTAA posted an above-average performance in September. The gains came from all three assets held, with WTI accounting for the largest share. This is surprising because both WTI and interest rates rose, which theoretically should have led to falling risk assets. But this demonstrates once again why it’s better to follow trends than to predict them.


Outlook 10/26


As expected, WTI, BTC, and QQQ remain the assets with the strongest momentum in the portfolio and will therefore stay in the portfolio. Aside from minimal rebalancing, the strategy is: Just keep going!


Report from the 3xGTAA Workshop


I’ve decided not to include -3xTLT in the asset pool (even though the ETF gained +25% last month). At first, there simply weren’t any backtests, which understandably raised some critical voices among you. Then @flyingsquirrel actually managed, with the help of AI, to create a synthetic backtest going back to 2004 for 3xGTAA, including -3xTLT! This revealed three key points:

1. Overall, the performance contribution of -3xTLT is negative, meaning the model performs just as well—or better—in the long term without it. However, it’s important to note that the backtest is based on a regime of falling inflation and interest rates.

2. In 2022, when interest rates suddenly rose significantly after a long period of stability, the performance contribution was clearly positive. However, as a single data point, its significance is rather limited.

3. The inclusion of -3xTLT becomes interesting only when combined with various other strategies, as -3xTLT significantly reduces the correlation among the models and thereby also lowers the maximum drawdown of the overall portfolio by approximately 5%. However, this is irrelevant for most 3xGTAA investors, so the only real advantage is negligible.

For myself, I conclude that in the coming period of rising interest rates, I will tactically use -3xTLT in my trading portfolio depending on the signal situation. For me, this will essentially become a private “4th asset” within the 3xGTAA strategy. The Wikifolio remains unaffected by this.


The extensive backtests of @flyingsquirrel have also shown results that definitely have an impact on the 3xGTAA Wikifolio. All sorts of scenarios were tested, some dating back to the early ’90s: asset baskets with and without BTC, lookback periods, averages, trading days, number of assets, asset weightings, leverage, etc. An incredible effort at the forefront of LevGTAA research! The results are sometimes quite complex, but they consistently point in the same direction: the 3xGTAA base model is close to optimal across nearly all parameters and behaves very robustly. Any further optimization significantly increases the complexity of the model and its rules. Some are willing to tolerate greater complexity for a few more percentage points of performance probability, while others prefer the simplicity and robustness of the base model. I myself belong to the latter group and have decided to return to the simple 3xGTAA model:


Asset Pool: 3xQQQ, 3xEU50, 3xGLD, 3xTLT, 2xWTI, 1xBTC, CASH

Selection: Signal execution on the 1st of the month, Top 3 momentum over the last 1 to 9 months, SMA10 > SMA150

Attentive readers will notice that Forex (EURUSD, USDEUR) has been omitted. Longer backtests have not demonstrated any added value here. Apart from increased portfolio turnover, they offer neither advantages nor disadvantages. Real-time experience to date confirms this.


However, some questions remain unanswered:

1. The longer tests show a measurable advantage of 3xEM compared to 3xEU50, despite the lack of a momentum effect in China (likely due to the EM boom in the early 2000s). I need to delve deeper into this to make an informed decision.

2. The tests were run on a synthetic 3xTLT. But such a product does not exist on the market. There is only a 3xIEF (10-year) or a 5xTLT (from Leverageshares). It will still take some time before that happens and interest rates fall again.

3. The longer-term tests have shown that while adding WTI boosts performance, it also causes portfolio volatility to rise even more significantly. This has a negative impact on risk metrics. Nevertheless, commodities should not be missing from a comprehensive asset model. However, since there is currently no leveraged commodity ETF on the German market, the 2xWTI is a compromise that will be discontinued as soon as the offering improves.


What do you think about returning to the simple model? Not that it changes my decision, but I’m interested in your opinion. And remember:


GTAA is a process, not a result.


Yours, Epi

$DE000LS9U6W1 (+1 %)

https://www.wikifolio.com/de/de/w/wf03x0gtaa

previw image
73
33 Comentarios

Imagen de perfil
Thanks for your amazing work and to all the test bakers as well👍
I think the simplified version of the model is better; “keeping it simple” often leads to success and, more importantly, often prevents failure.
I’m still thrilled and remain convinced.
•
6
•
Imagen de perfil
1Semana
@Psychedelic_Sunflower Thank you, too!
••
Imagen de perfil
I also think the previous method is better. I always find bonds a little too “political.”
But I think EM is missing here. It’s certainly worth considering.
•
2
•
Imagen de perfil
1Semana
@Olli68 🫡
••
Imagen de perfil
Never change a system that works 🤌🏻 Thank you so much for all the incredible work that went into these results!
•
1
•
Imagen de perfil
1Semana
@FinanzMechaNikk Don't thank me for the work! I do it mostly for myself. This year alone, 3xGTAA brought me over 40k in paper profits. It's worth it.

Instead, thank me for the transparency and for sharing my insights. That costs me more and brings me less. In a way, I see it as my mission to spread the word about the momentum strategy, just as Kommer promotes the idea of passive index investing.

You’ve got to have some kind of mission in life, right? 😏
•
4
•
Imagen de perfil
Glad to see you're still alive.

What's the biggest drag on performance? Equal-weighted +12.4, +28.7, and +11.1 don't sound like a total return of 12.4%.

I like the simple model. If you do end up kicking me out, it’ll be easier to replicate.

Speaking of kicking me out, I don’t see your issue with WisdomTree’s leveraged products mentioned in the post
•
1
•
Imagen de perfil
1Semana
@DonkeyInvestor That's right, the performance data doesn't quite match up. This is often a problem when I simply look up the monthly performance figures on Wikifolio instead of calculating the actual performance. If the observation period isn't exactly one month, discrepancies arise.

Another advantage of the simple model is that the ETFs to be traded are less exotic, so the liquidity issue can be put off for a while longer.

I’ve saved the liquidity issue for the next workshop report. One thing at a time. 🫡
•
1
•
Imagen de perfil
Top
•
1
•
@Epi, In your backtest, did the 1-, 3-, 6-, and 9-month momentum yield better results than the 1-, 3-, 6-, and 12-month momentum, which is more commonly used in the literature?
•
1
•
@Spouh In my backtests using MTD, 3, and 6, the strategy reacts more quickly to trends than Faber's 1/3/6/12 variant. And both performance and maximum drawdown benefit as a result.
•
1
•
Imagen de perfil
1Semana
@DEW_7240 Yes, the results were clear and better across various models—higher CAGR, higher Sharpe ratio.
The reason? The momentum effect likely diminishes after 9 months. After 12 months, it’s barely detectable anyway. Furthermore, 9M roughly corresponds to the SMA150 used.
••
@DEW_7240, Did you only use 1-, 3-, and 6-month momentum in your backtest?
••
Imagen de perfil
1Semana
@DEW_7240 3/6M works, too. But it's not quite as sturdy.
••
@Epi, Is weighted momentum not used in the backtest? Does each month (1, 3, 6, 9) have the same weight?
••
Imagen de perfil
1Semana
@Spouh Yes, balance is the most robust.
••
@Spouh I'm currently testing a weighting of 50% MTD / 25% 3M / 25% 6M for performance calculations. In backtests so far, this has yielded better results than an equally weighted calculation.

However, this does not apply to leveraged products! In those cases, the monthly swings are too extreme and create volatility.
••
Imagen de perfil
1Semana
@DEW_7240 What do you mean by "better"? CAGR, SR, mDD, robustness?
••
@Epi Performance, CAGR, Sharpe ratio.
But it also became clear that the selection of ETFs and their volatility, in turn, influence the results. Therefore, these factors must always be considered together.
The mDD was actually influenced more by the selection of the long list than by the performance calculation.
•
1
•
Imagen de perfil
1Semana
@DEW_7240 Exactly. Finding a good model that suits you takes some work. But it's worth it. 👍
•
1
•
Ver todas las 2 respuestas adicionales
Imagen de perfil
I had also observed points 1 and 3 in my backtests. I tested the TLT as well; I would have liked to include it with a leverage of 2 or 3. When leverage exceeded 3, the trade backfired on me; I now have a 50/50 split between $DTLA and $TLT5 in my portfolio.
However, I only tested long positions, since that made more sense given the negative correlation with stocks.
•
1
•
Have you tried using energy ETFs instead of the WTI—not just oil and gas, but broad-based energy?
There would be a slight overlap with QQQ, but the volatility could drop significantly.
••
Imagen de perfil
1Semana
@DEW_7240 Usually, energy ETFs have natural gas as their only major holding besides various types of oil. While this reduces volatility, it also lowers performance.
Besides, I haven't found any tradable candidates for 2/3x energy so far—just this one, and I don't think it's any good: $3XEE

Do you have a better one?
••
@Epi I’m staying out of leveraged products—I don’t know my way around them (yet).

But yes, the maximum return is higher with pure WTI; the question is whether the strategy can actually lock in those gains before the price drops again.
Whether the 100/150 SMA at the end/beginning of the month is tight enough to prevent losing the added value compared to less volatile options.
•
1
•
Imagen de perfil
1Semana
@DEW_7240 These are the trade-offs that need to be explored in a backtest. Most of the time, it's not as clear-cut as one might intuitively assume.
••
Imagen de perfil
I'm keeping my fingers crossed for everyone here (myself included) that this project doesn't suffer the same fate as most CTAs... 🍀
https://www.bankeronwheels.com/the-managed-futures-graveyard/
https://alphaarchitect.com/short-term-trend-following/?weekend-reading-link-230926/
••
Imagen de perfil
1Semana
@TotallyLost I'm in on this, too. I'm heavily invested myself—I think that gives everyone involved at least a little peace of mind. By the way, your link already foreshadowed its fate in the graveyard. ;-)
•
1
•
Congratulations on the performance! Quick question: the SMA10>SMA150 rule is new, too, right? If it is new, could you please say a few words about it?
••
Imagen de perfil
1Semana
@gaze123 It's not entirely new. Every now and then, prices hover very close to the SMA150, fluctuating around it throughout the day. To bring some stability and clarity to this situation, the SMA5 has been the go-to method so far. In backtests, however, the SMA10 has proven to be more effective.
•
1
•
Imagen de perfil
How can I actually invest in your certificate?
••
Imagen de perfil
1Semana
@DerJuwelier Take a look at the profile. There's a link there to the documents with the information. Otherwise, just copy the ISIN, paste it, and you're done.
••
Únase a la conversación