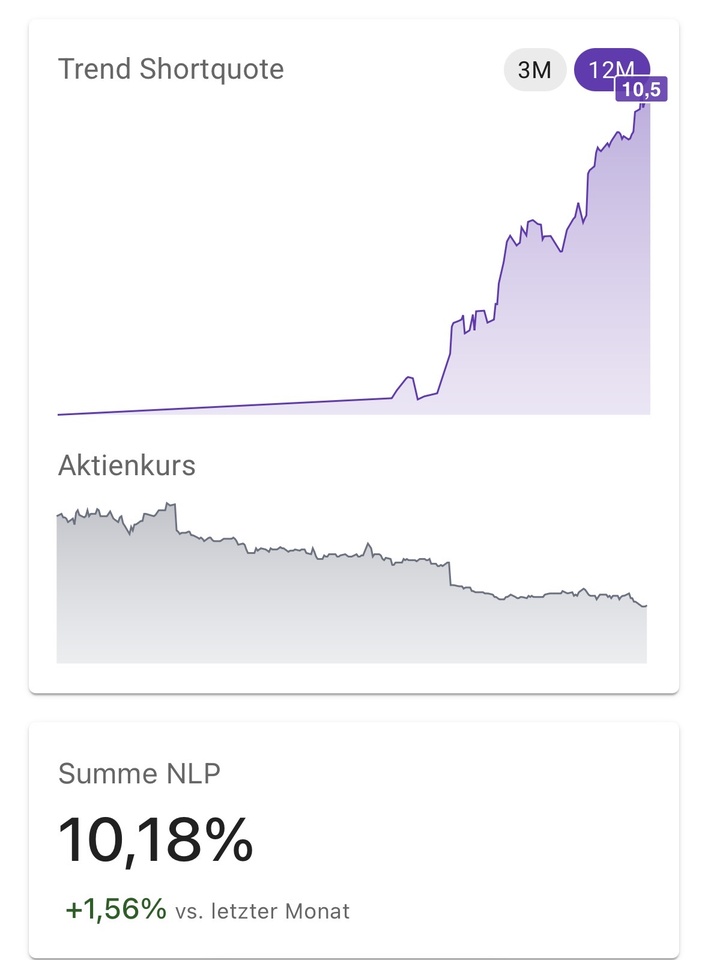
12H·

Teamviewer continues to fall

The $TMV (+0,54 %) share, now the largest position in our portfolio, continues to fall. It is noticeable that short selling continues to increase.


The short selling ratio is now over 10% and the short sellers are continually adding to their positions. We are doing the same, only we are increasing our holdings further.


The most interesting thing is who is shorting the shares. It is mainly funds that only look at the chart and use trends to trade.


This makes the purchase by value investor Harris Associates all the more exciting. It now holds more than 3% of the shares and mainly buys shares that it believes are fundamentally undervalued.

https://www.boerse.de/nachrichten/EQS-PVR-TeamViewer-SE-Veroeffentlichung-gemaess-40-Abs-1-WpHG-mit-dem-Ziel-der-europaweiten-Verbreitung/38144319


It is clear that the trend points to a further fall in share prices. However, if you ignore the chart (in our view, the astrology of share trading), you will find a valuation that would only be justified if the company no longer generates any sales in 10 years at the latest. The company currently has a KCV of around 4, a forward P/E ratio in the 5 range and a dividend yield of 25% could be paid from the cash flow.


Even with years of 0% growth, we believe this is a valuation that perhaps logistics companies had for a short time during the coronavirus crisis.

attachment
4
28 Comentarios

Imagen de perfil
The 25% "dividend yield" is somewhat misleading - this is the FCF yield, not a dividend. TeamViewer pays out nothing and still has almost €900m in debt, which must first be reduced.

And that only chart-oriented funds are shorting - I would be cautious about that. AQR and Qube Research are also involved, and they are highly quantitative funds - they definitely don't just look at the chart.

The "zero turnover in 10 years" statement is of course an exaggeration to illustrate the point - I realize that - but for someone who doesn't know the context, it can quickly come across wrong.
6
Imagen de perfil
@Ash this is the potential dividend yield, as emphasized.

As a quantitative fund, AQR also mainly looks at trends.

This is not even an exaggeration. Even with falling sales, it would be exciting at the current valuation.
Imagen de perfil
@fiducation Thanks for the feedback, but I would like to ask two points again:

On the "potential dividend yield": Yes, you wrote "could" - that's true. But as long as there is just under €900 million in debt on the table, that is very theoretical. For many readers, the term "dividend yield" suggests more than a pure FCF consideration.

And regarding AQR and trends: I wouldn't leave it at that. AQR is a classic multi-factor fund - they combine value, momentum, quality and low volatility. Momentum is one of four factors, and AQR itself has shown in its own research that it deliberately uses value and momentum in opposition to each other. "Mainly trends" doesn't really fit the bill.

On the third point: TeamViewer itself has forecast revenue growth of 0-3% for 2026 - so there is currently no question of declining revenues. It is true that the valuation is nevertheless interesting - but this is a valuation statement, not a fact. And for someone without the necessary context, "zero sales in 10 years" sounds like a factual assessment, not a rhetorical exaggeration, which I actually wanted to give you credit for. 😄
1
Imagen de perfil
@Ash It is not a theoretical term because interest is already taken into account in the FCF. This target figure is calculated for precisely this reason: Potential distributions to shareholders.

I am not sure if you have understood the AQR approach correctly. You combine these methods in a fund in order to diversify better. In the end, the correlation to the MSCI World is the only deciding factor here. In the case of TeamViewer, this is strongly negative, which is why the share is shorted on momentum. This is not a case-by-case analysis and the chart picture is also decisive here.
@Ash thanks for the clarification, newcomers in particular might be tempted to buy by such an article.
2
Imagen de perfil
@Frei Unfortunately, the colleague has no idea
@fiducation Is it true that the mountain of debt amounts to 900 million?
Imagen de perfil
@Frei An absolute view is also completely misleading. More exciting here is the multiple consideration in relation to EBITDA, with 2, absolutely within the framework.
Imagen de perfil
@fiducation But that was not the question of @Frei
1
Imagen de perfil
@Ash the question makes no sense without a reference value
Imagen de perfil
@fiducation On the FCF point: Yes, interest is already included in the Levered FCF - that is correct. But that doesn't change my actual argument. You wrote "could" yourself - and that is precisely the point: it remains a very theoretical "could" as long as TeamViewer has clearly communicated that the FCF is primarily planned for debt reduction. The money therefore does not flow to the shareholders, and a "dividend yield" implies precisely that. The term therefore remains misleading, regardless of how the FCF is calculated.

However, I would disagree with the AQR point. AQR itself has explicitly advocated an integrated approach, where stocks are valued on multiple factors simultaneously - it even says so in their own paper "Don't Just Mix, Integrate". The approach of only focusing on one factor for individual stocks contradicts their own published methodology.

Whether momentum was the decisive factor for TeamViewer - I admit that this cannot be judged conclusively from the outside. But "obviously momentum" is a bit of a stretch if you don't know the strategy behind it.
1
Ver todas las 7 respuestas adicionales
Why is this your biggest position?
Imagen de perfil
@value_visionary_qrkql we justify in the article ☝️
How long have you been investing and analyzing stocks?
Imagen de perfil
@value_visionary_qrkql since yesterday
Oh well then, let me enlighten you, of course the chart says something and should always be taken into consideration. But then you still have time to adjust it :)
Imagen de perfil
@value_visionary_qrkql How do you arrive at this assessment?
I picked that up once, it was about the psychology of the market someone called Mr. Market and something like a trend and that he can be your friend.

But I don't know exactly, as I said I just look at it and consider it when making my short investment decisions.

Maybe you'll find out - you still have plenty of time to learn.

How is your performance, I can't really see it, but I'm also new here...
Imagen de perfil
@value_visionary_qrkql That's interesting, from a scientific perspective there is actually nothing to be said in favor of the chart technique, especially not in the long term. But if Mr. Market says that, then all the renowned scientific studies must be wrong.
Yes, that's probably true, so have you already been successful with your methodology and how high is your outperformance or have you not been doing this for so long that the data would be usable Evidence is the right word here, isn't it?
Imagen de perfil
@value_visionary_qrkql We have outperformed the DAX as a benchmark, but not the MSCI World. However, it is not evident at 6 years. However, we also estimate the probability of outperforming the market as low. Most fund managers don't manage it either 😅
Únase a la conversación