
A cash-flow-strong specialist or a broad-based scientific equipment supplier
Following Johnson & Johnson $JNJ (+0,9 %) versus Abbott $ABT (+0,07 %) , today we’re taking a look at two companies that are behind many medical advances.
Danaher $DHR (-0,31 %)
and Thermo Fisher
$TMO (+1,3 %) supply the equipment, materials, and services that others use to conduct research, make diagnoses, and develop or produce medications. Their names rarely appear on the final treatment. Nevertheless, their products are needed time and again along the way.
That’s exactly what makes this showdown so exciting.
Anyone betting on the success of a single drug must very carefully assess its clinical trials, approval process, and competition. For these suppliers, the risks are spread across many customers and projects.
However, that doesn’t protect them from a shared downturn: When biotech companies cut costs, research funding dries up, or production capacities were planned too generously, Danaher and Thermo Fisher feel the impact as well.
How the Two Make Their Money
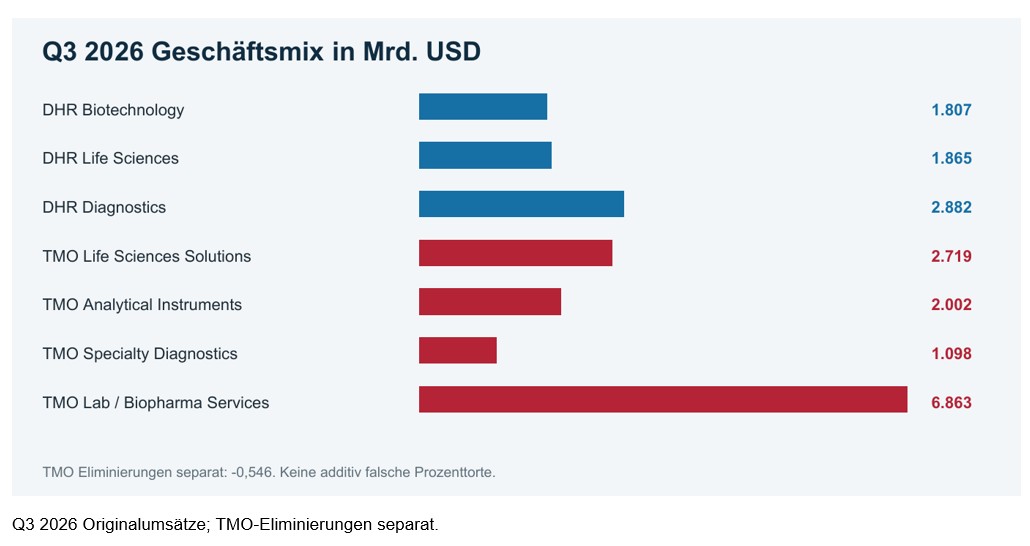
Danaher was built up over decades by brothers Steven and Mitchell Rales through acquisitions and operational improvements. With the spin-offs of Fortive and Veralto, the focus shifted to healthcare and life sciences. Today, biotechnology, life sciences, and diagnostics drive the business. Cytiva and Pall support the production of biologic drugs; Beckman Coulter, Cepheid, and Leica serve laboratories and the diagnostics sector. Abcam and Aldevron provide antibodies, reagents, and raw materials for modern therapies.
Thermo Fisher was formed in 2006 from the merger of Thermo Electron and Fisher Scientific. With the addition of Life Technologies, Patheon, PPD, and, more recently, Clario, it has become a provider covering large parts of the research and development process. The company sells laboratory consumables, analytical instruments, and reagents; organizes clinical research; and manufactures on behalf of pharmaceutical clients. A customer can therefore start with a small laboratory order and later purchase numerous additional services.
The difference is evident in the revenue figures:
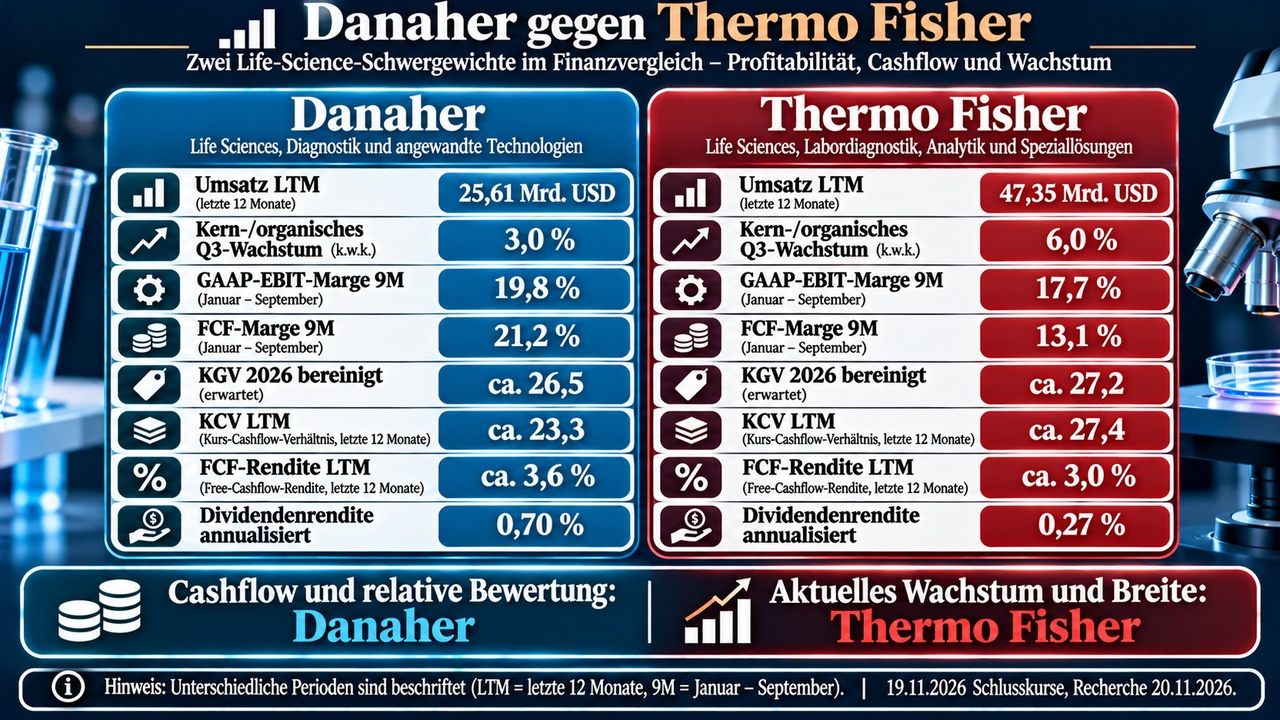
Danaher generated approximately $25.6 billion in revenue over the past twelve months, while Thermo Fisher generated $47.4 billion. Thermo Fisher’s size provides purchasing power and access to customers. Danaher’s more focused business mix allows a larger portion of revenue to translate into free cash flow. These differences are economically more significant than absolute size.
Danaher: Growth and Financial Quality
Danaher’s recovery is underway, but it remains uneven. In the third quarter, revenue rose to $6.55 billion. Adjusted core growth was 3 percent; excluding respiratory tests, it was 5.5 percent. This caveat is important because the respiratory testing business continues to drag on growth. An adjusted growth figure captures a useful segment of the business, but it does not, on its own, account for the entire company’s performance.
The brighter side of the story lies in bioprocessing. Consumables and validated processes can remain tied to the production of a drug for a long time. A change requires validation work and increases
production risk. The growing order volume described in the research report supports the recovery thesis; however, converting these orders into revenue remains crucial. An order for a piece of equipment does not yet translate to a sustained increase in the consumption of filters or reagents.
Cash flow quality is the strongest metric in this comparison. Nine-month revenue of $18.77 billion generated $3.98 billion in free cash flow, or about 21.2 percent. Free cash flow was significantly higher than reported net income. The GAAP operating margin for these nine months was 19.8 percent. For the third quarter, Danaher reports an adjusted margin of 29 percent; these two margins must not be conflated without proper clarification.
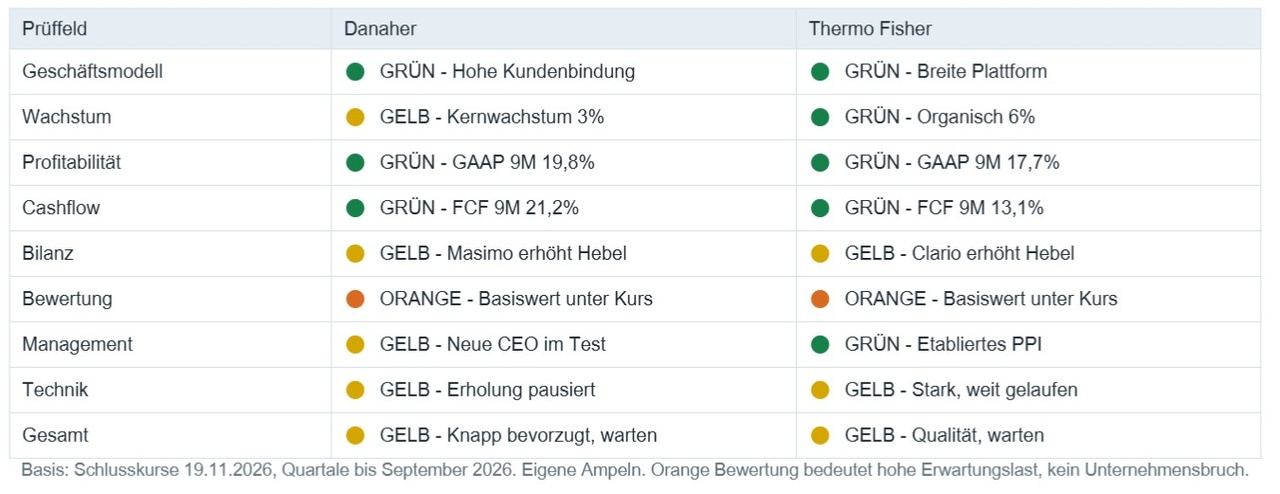
Masimo is expanding its diagnostics business to include continuous patient monitoring. At the same time, the acquisition serves as a stress test for capital allocation. Following the acquisition, debt rose significantly. My preliminary assessment is therefore positive regarding the business model and cash flow, but more cautious regarding the balance sheet. Danaher must prove that the higher debt will decline again as a result of growth and integration.
Thermo Fisher: Growth and Financial Quality
Thermo Fisher is currently growing faster. In the third quarter, the group posted revenue of $12.14 billion and six percent organic growth. Laboratory Products and Biopharma Services performed particularly strongly. Life Sciences Solutions, on the other hand, saw only weak organic growth. The recovery is therefore not yet affecting all business segments at the same pace.
This breadth can be an advantage: Clinical Research and Pharma Services can grow before customers start ordering more high-quality reagents again. PPD and Clario strengthen the connection to clinical trials. Clario provides digital measurement and endpoint data needed to evaluate a therapy. This enables Thermo Fisher to offer more services within the same customer project.
The higher proportion of services accounts for part of the margin gap. In the first nine months, the GAAP operating margin was 17.7 percent. Revenue of $35.14 billion generated $4.62 billion in free cash flow, representing a margin of approximately 13.1 percent. In absolute terms, this is more than Danaher’s, but less relative to revenue. The adjusted Q3 margin of 24.5 percent offers a different perspective and is also below Danaher’s.
Caution is warranted regarding the recent jump in profits: The research report cites one-time tariff refunds as part of the positive effect. Such refunds are not carried forward as a permanent operational improvement.
My preliminary assessment: Thermo Fisher has the edge in terms of breadth and current growth. For a higher price, the improvement would also need to be reflected in sustainable cash flow per share.
Product Development and Growth in the Coming Years
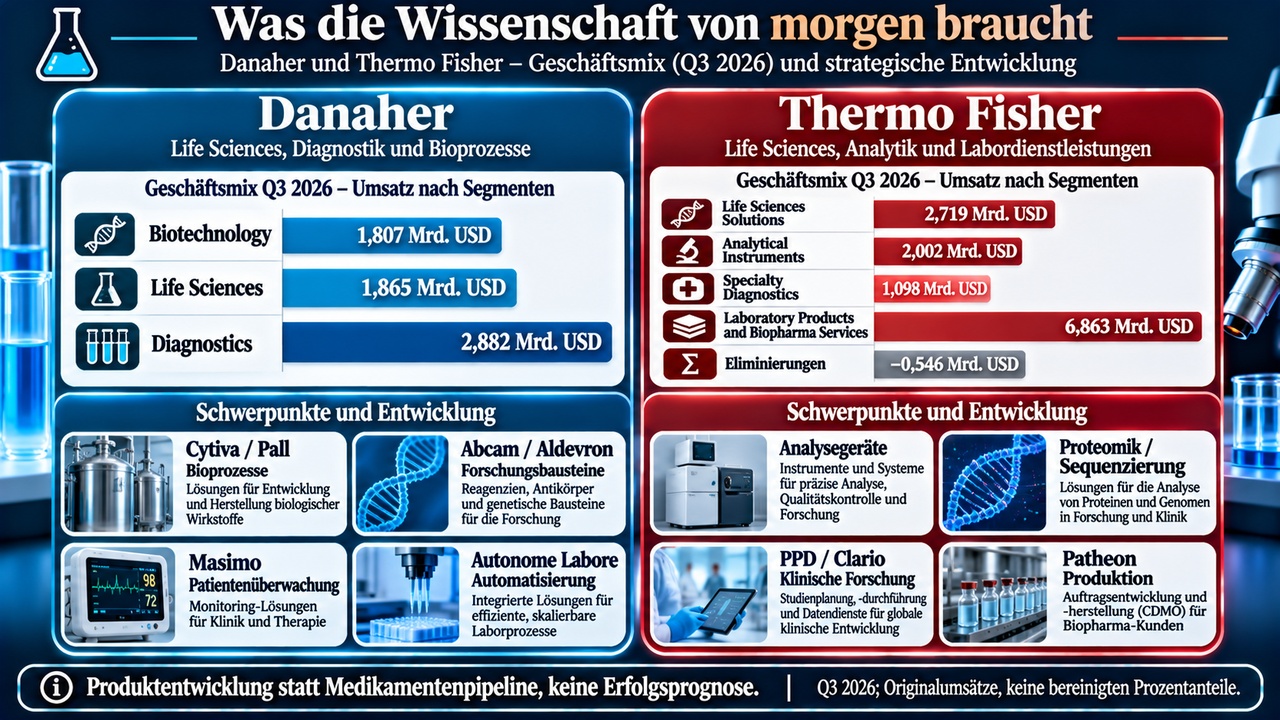
A traditional drug pipeline would be a misrepresentation for these companies. Their future lies in new devices, reagents, digital tools, production capacity, and the expansion of already installed systems. What matters to investors is whether this results in recurring revenue and a better return on capital employed.
At Danaher , bioprocessing, protein and antibody research, and diagnostics are the key areas. Cytiva stands to benefit from an increase in biological therapies; Abcam and Aldevron supply building blocks for research and new forms of therapy. Masimo is expanding its diagnostic offerings. The leverage is particularly high when new facilities later trigger additional consumption of materials. If the expected capacity utilization falls short, this leverage remains smaller than hoped for.
Thermo Fisher combines new analytical instruments with proteomics, sequencing, and services. Recent products include the Orbitrap Isora, the EMPAD G2 detector, and the Ion 560 chip. At the same time, PPD, Patheon, and Clario expand the ability to support a customer from clinical trials through to production. The platform offers many opportunities but also requires careful integration and reliable quality in contract manufacturing.
I see Danaher as the more focused pathto participate in the next wave of biological therapies. Thermo Fisher has a broader stake in research spending and outsourced development tasks.
The larger addressable market alone does not make Thermo Fisher the better stock; for that to happen, the additional breadth must be reflected in cash flow per share.
Valuation metrics clearly explained
For the valuation, I use the last completed U.S. trading day, November 19, 2026.
Danaher closed at $227.56, and Thermo Fisher at $688.75. The pre-market prices marked in orange on the screenshots—$226.64 and $689.36, respectively—are separate snapshots. The historical values visible in the upper left are part of the crosshairs and are not current closing prices.
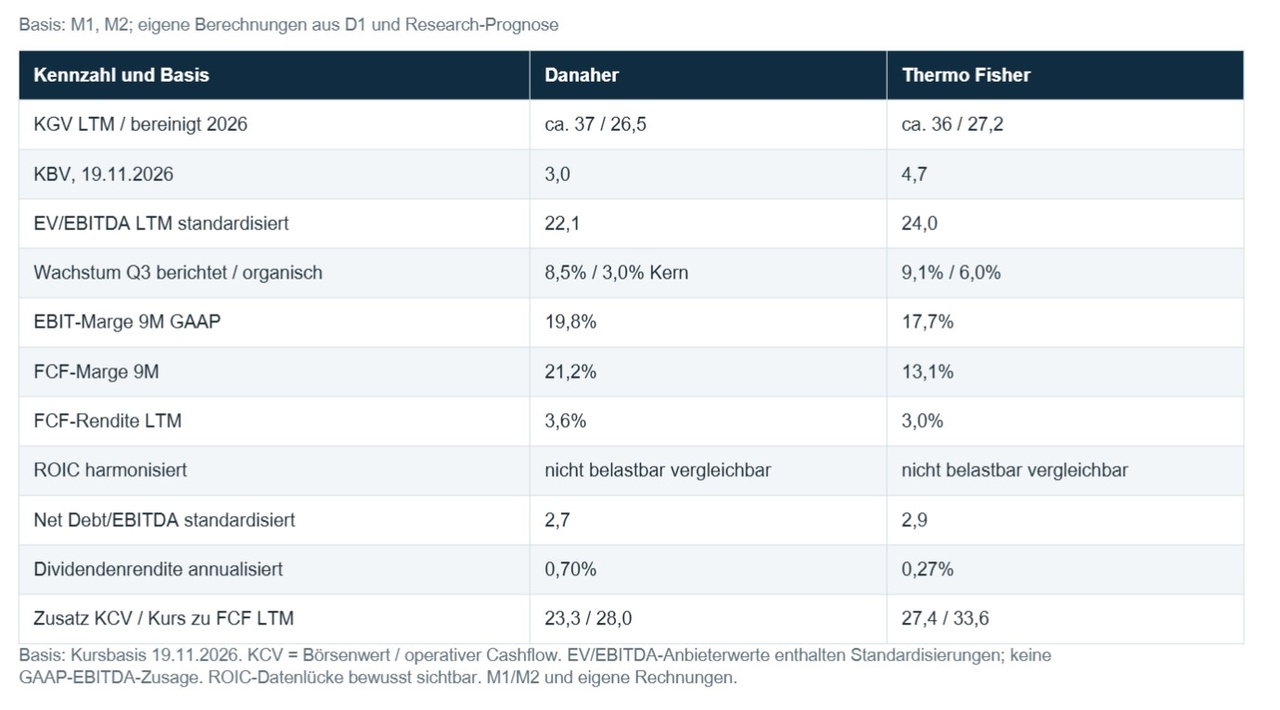
Danaher’s trailing price-to-earnings ratio is around 37. Based on the company’s forecast of $8.57 to $8.62 in adjusted earnings per share for 2026, this results in a P/E ratio of approximately 26.5.
Thermo Fisher stands at around 36 on a trailing basis; using the median forecast of $25.28 documented in research, the adjusted 2026 P/E ratio is approximately 27.2. The difference between the trailing and adjusted P/E ratios shows just how much depreciation, acquisition costs, and other adjustments alter the picture.
For the price-to-cash-flow ratio (P/CF), I use the operating cash flow from the last twelve months. This results in ratios of approximately 23.3 for Danaher and 27.4 for Thermo Fisher.
However, operating cash flow does not yet account for investments in plant and equipment. Based on free cash flow, the stocks trade at approximately 28 times and 34 times, respectively. The corresponding free cash flow yields are around 3.6 and 3.0 percent. Here, Danaher offers the more tangible valuation gap.
The price-to-book ratio is approximately 3.0 for Danaher and 4.7 for Thermo Fisher. Both balance sheets include significant values from acquisitions. A lower P/B ratio is therefore not, in and of itself, proof of a bargain. The enterprise values relative to standardized EBITDA of approximately 22 and 24, respectively, also reflect high expectations. EBITDA excludes depreciation and amortization and says little about whether an expensively acquired enterprise value will generate a good return in the long term.
Danaher’s net debt, including lease obligations reported by the data provider, stands at approximately $22.1 billion, while Thermo Fisher’s is approximately $35.3 billion. Measured against standardized EBITDA, these figures are approximately 2.7 and 2.9, respectively. Both companies can finance their operations from their core business, but following major acquisitions, they have less financial flexibility than they would with a low-debt balance sheet.
An ROIC defined in exactly the same way cannot be reliably derived from the available data provider figures; the ROI figures cited there—approximately 6.4 and 8.4 percent—are expressly not presented as a directly comparable ROIC.
Competition and Customer Structure
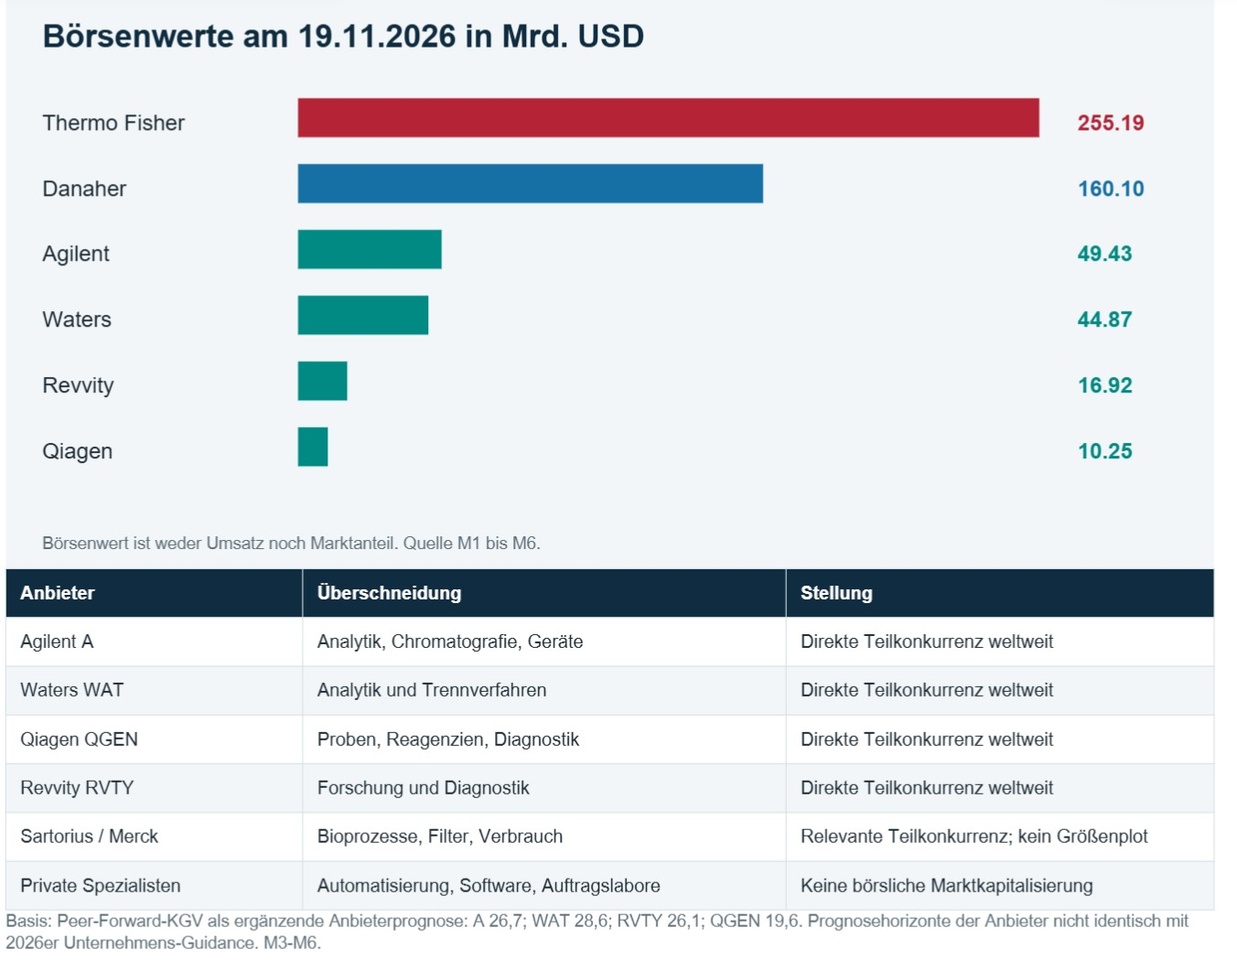
Both companies compete with each other, but not in every segment. Agilent and Waters are particularly important in analytics. Qiagen and Revvity overlap in sample preparation, reagents, and diagnostics.
In bioprocessing, Sartorius and Merck (with MilliporeSigma) are also players; Thermo Fisher’s services also include major contract research organizations and contract manufacturers. Competition takes place globally, with additional local providers and procurement requirements in China.
Danaher’s competitive advantage stems from its proven processes, installed equipment, consumables, and application expertise.
Thermo Fisher’s strength lies in the combination of product portfolio, sales, service, and deep customer relationships. Standard products remain price-sensitive.
Highly specialized applications are more difficult to substitute, but even there, suppliers must keep pace technically.
A current top-5 or top-10 customer share is not reliably reported in the audited documents for either of the two groups. I treat this as a data gap. In any case, the greater dependence often stems from a shared end market: pharmaceutical and biotech budgets, hospital procurement, and academic and government research. Many customers can generate savings simultaneously, even if no single customer is particularly large.
Consumables can be recurring without a contractually guaranteed annual purchase volume. Studies can be postponed, orders can be changed, and production programs can be discontinued. Therefore, the term “recurring” should not be equated with a guaranteed subscription. My preliminary assessment remains positive regarding customer loyalty, but only “yellow” regarding the transparency of individual customer concentration.
AI as an Opportunity and a Competitive Risk
AI can suggest better molecules and select experiments more precisely. This increases the importance of reliable experimental data.
Danaher’s collaboration with NVIDIA and the planned autonomous lab at Abcam fit into this context. However, the collaboration itself does not yet translate into additional revenue or a sustainably higher margin.
Thermo Fisher can utilize AI in analytical instruments, clinical trials, and laboratory workflows. A meaningful advantage arises when customers can evaluate measurements more quickly, organize studies more efficiently, or avoid errors. A software feature without measurable benefits, on the other hand, creates little pricing power.
I consider the direct threat of a complete replacement of the devices and consumables to be low for both companies. Over the next three to five years, the greater risk is that open interfaces, automated laboratories, or specialized software providers will take over part of the customer relationship. Additionally, better models could reduce the number of unsuccessful experiments per candidate. It remains to be seen whether an increase in the number of projects will more than offset this efficiency gain.
Danaher receives a “green” rating for the direct AI threat, while Thermo Fisher receives a “yellow” rating due to its broader data and service interfaces. These are qualitative assessments. Warning signs would include falling prices for analysis, weaker equipment retention, lower consumption per active customer, and rising software costs without higher customer returns. For the valuation, I do not assume a blanket AI revenue bonus.
Dividend and Payout Coverage
Danaher currently pays $0.40 per quarter, or $1.60 annualized. Based on the closing price, this yields a return of approximately 0.70 percent.
Thermo Fisher pays $0.47 per quarter, or $1.88 annualized, representing a yield of about 0.27 percent. Both dividends are well supported by free cash flow.
Based on the current number of shares, the annualized dividend burden corresponds to approximately 20 percent of Danaher’s most recent FCF and 9 percent of Thermo Fisher’s FCF.
The amounts actually paid in the calendar years 2021 through 2025 rose from approximately $0.81 to $1.23 per share at Danaher and from $1.00 to $1.68 at Thermo Fisher. Over a four-year period, this corresponds to annual growth of approximately 11 percent and 14 percent, respectively. Danaher’s spin-off of Veralto affects comparability: in 2024, slightly less was paid per Danaher share than in 2023; the Veralto share received separately is not included in this series.
Both companies receive a “green” rating for their current dividends. For an investor seeking current income, Danaher is the relative favorite. In absolute terms, both yields are low. The return on these investments must come primarily from growing cash flow per share and a reasonable entry price.
What the stocks might be worth based on my own valuation
I also value both companies using a cash flow model.
The starting point is the most recent free cash flows of approximately $5.7 billion for Danaher and $7.6 billion for Thermo Fisher.
To account for stock-based compensation, one-time items, and normalization, I adjust these figures in the model to $5.2 billion and $6.7 billion, respectively. This is my own conservative assumption, not a company forecast.
In the base case scenario , this normalized cash flow grows by 8 percent annually for ten years. After that, it grows at a sustained rate of 2.5 percent. With a cost of equity of 8.5 percent, this results in a value of approximately $192 per Danaher share and $468 per Thermo Fisher share. Net debt is not deducted again because, in this case, cash flow after financing costs is valued as an equity approximation. The model assumes a sustainable level of debt over the long term and no additional wave of debt-financed growth.
The conservative scenario assumes 5 percent growth, a 9.5 percent cost of capital, and a terminal growth rate of 2 percent. The optimistic scenario assumes 10 percent growth, a 7.5 percent cost of capital, and a terminal growth rate of 3 percent. This results in a range of $125 to $296 for Danaher and $304 to $722 for Thermo Fisher. The wide range is the honest result of long-term assumptions.
Both stocks are trading above my fair value. Danaher is relatively closer to a sustainable valuation. Thermo Fisher needs more sustainable growth or better cash flow conversion to justify its current price.
A technical entry zone may therefore be useful for a trade without yet offering a large fundamental margin of safety. For a true margin of safety of 15 percent relative to the intrinsic value, my calculated long-term prices would be approximately $163 and $398, respectively.
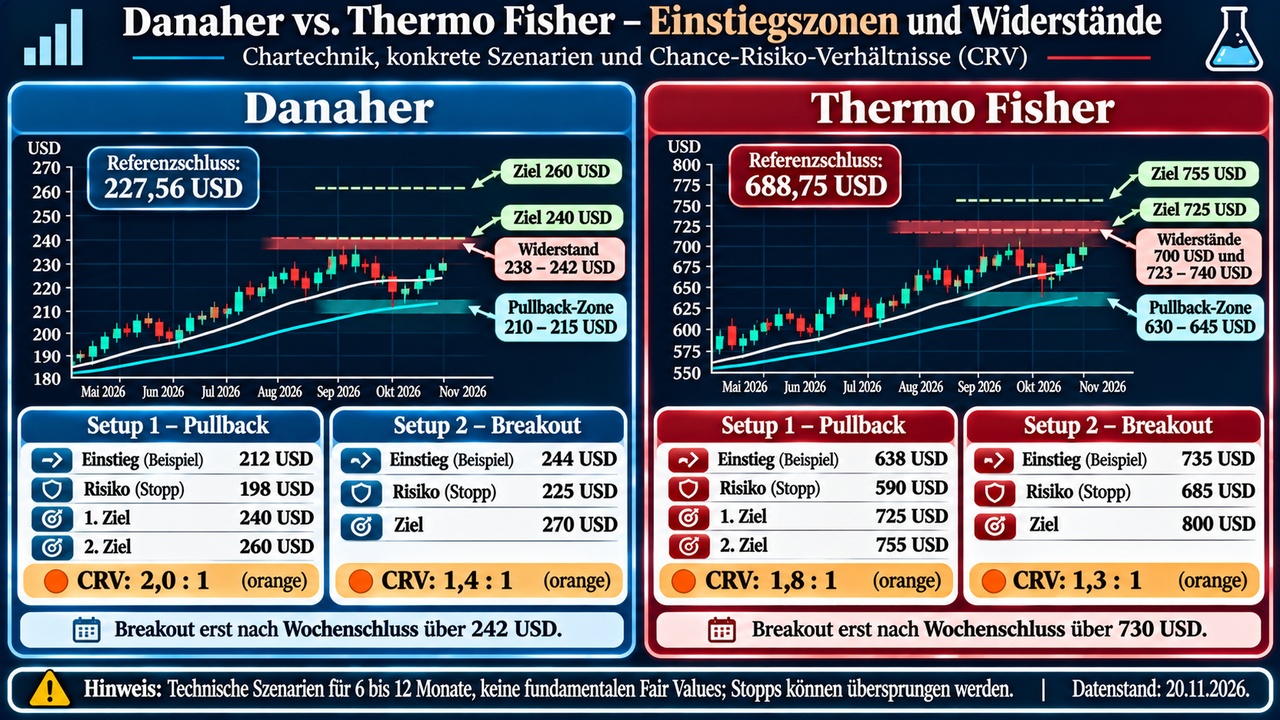
Chart Analysis and Entry Plan for Danaher $DHR (-0,31 %)
Danaher has recovered significantly from its spring low. On the daily chart, the key moving averages are around $224 and $210. The RSI at 48 and a weakening MACD indicate a pause in the upward trend. The weekly chart remains constructive, with the RSI around 59 and positive, though somewhat weaker, momentum. The resistance zone lies between $238 and $242.
For a contrarian entry, I’m watching the $210 to $215 range. Using a sample calculation at $212, with a risk level at $198 and a first target at $240, the potential gain is $28 for a risk of $14—a 2.0-to-1 ratio. This corresponds to an orange CRV signal. Up to a second target of $260, the ratio would be 3.4 to 1, but this more distant target is less certain.
The procyclical alternative would be a confirmed weekly close above $242. An example at $244, with a risk of $225 and a target of $270, yields only about 1.4 to 1. This option is more expensive and has the worse theoretical ratio. I prefer the pullback and would not jump on a breakout solely because of an analyst’s target.
For a trade lasting six to twelve months, a pullback below $198 would signal a technical reevaluation; once $240 is reached, an initial profit-taking move may be advisable. For a long-term investment spanning three to five years, however, what matters is whether core growth, cash flow per share, and debt reduction confirm the investment thesis. A technical level does not replace this assessment.

Chart Analysis and Entry Strategy for Thermo Fisher $TMO (+1,3 %)
Thermo Fisher’s long-term uptrend is currently stronger but also more advanced. On the daily chart, the first support level is around $670. Below that are the $630–$640 range and, further down, approximately $590. The daily RSI around 50 indicates consolidation, while the weekly RSI around 67 still signals strong momentum that has run relatively far. Resistance levels are at $700 and $723 to $740.
My preferred pullback range is between $630 and $645. If I assume an entry price of $638, a risk level of $590, and a first target of $725, the risk-reward ratio comes out to about 1.8 to 1, which is classified as “Orange.” A second target at $755 would result in a ratio of about 2.4 to 1. This fits on a watch list but does not yet offer an exceptional payout structure.
A confirmed weekly close above $730 would be the breakout alternative. With an entry price of $735, a risk level of $685, and a target of $800, the CRV is about 1.3 to 1. The stronger trend alone does not offset the higher purchase price. Here, too, I prefer the pullback.
Buy-limit and buy-stop orders would be alternative approaches. A standard buy-stop order does not automatically wait for the weekly close.
Anyone who requires confirmation of the closing price must wait for it first and then select an appropriate order. With a possible OCO (One Cancels the Other) order, the execution of one entry order would cancel the other; specific broker support for this has not been verified. Stops may be executed worse than planned in the event of price gaps.

My closing remarks and the next showdown
Danaher wins by a narrow margin in my view. The high proportion of recurring revenue, the stronger cash flow margin, and the lower price-to-free-cash-flow ratio tip the scales in its favor. Thermo Fisher remains ahead in terms of current growth, the breadth of its product offering, and the long-term chart. Those who place greater weight on these points may arrive at a different winner.
My practical advice for both is to wait and see.
The track record of quality is more compelling than today’s price. For Danaher, I’m initially watching the $210 to $215 range; for Thermo Fisher, the $630 to $645 range. These ranges represent technical pullback targets. For a long-term investment, I would also require a discount to intrinsic value.
What do you think? Do you prefer Danaher’s focused business in bioprocessing and consumables, or Thermo Fisher’s broader platform spanning from the lab to clinical research and production? And how much of a premium are you currently willing to pay for this quality?
Next up is Vertiv $VRT (-3,97 %)
versus Eaton $ETN (-3,14 %)
. Then we’ll look at power distribution, cooling, and data centers and compare how the two companies are profiting from the expansion of AI infrastructure.
Sources and Notes
[D1] Danaher Q3 2026 Earnings and Cash Flow
https://investors.danaher.com/2026-10-21-Danaher-Reports-Third-Quarter-2026-Results
[D2] Danaher Q3 2026 Form 10-Q
https://www.sec.gov/Archives/edgar/data/313616/000031361626000199/dhr-20260925.htm
[D3] Danaher 2025 Annual Report
https://www.sec.gov/Archives/edgar/data/313616/000031361626000062/dhr-20251231.htm
[D4] Danaher 2026 Proxy Statement
https://www.sec.gov/Archives/edgar/data/313616/000031361626000101/dhr-20260325.htm
[D5] Danaher and NVIDIA Collaboration
[D6] Danaher’s Autonomous Lab at Abcam
[D7] Danaher Dividend History
https://stockanalysis.com/stocks/dhr/dividend/
[T1] Thermo Fisher Q3 2026 Results
[T2] Thermo Fisher 2025 Annual Report
https://www.sec.gov/Archives/edgar/data/97745/000009774526000018/tmo-20251231.htm
[T3] Thermo Fisher 2026 Proxy Statement
https://materials.proxyvote.com/Approved/883556/20260323/NPS_629003.PDF
[T4] Thermo Fisher Completes Clario Acquisition
[T5] Thermo Fisher Dividend History
https://ir.thermofisher.com/investors/stock-information/dividends/default.aspx
[T6] Thermo Fisher Investor Day 2026
[M1] Danaher Market and Trading Data
https://stockanalysis.com/stocks/dhr/statistics/
[M2] Thermo Fisher Market and Trading Data
https://stockanalysis.com/stocks/tmo/statistics/
[M3] Agilent Market and Valuation Data
https://stockanalysis.com/stocks/a/statistics/
[M4] Waters Market and Valuation Data
https://stockanalysis.com/stocks/wat/statistics/
[M5] Revvity Market and Valuation Data
https://stockanalysis.com/stocks/rvty/statistics/
[M6] Qiagen Market and Valuation Data
https://stockanalysis.com/stocks/qgen/statistics/
Valuation, traffic light ratings, CRV, and entry zones are based on my own model assumptions. This is not personal investment advice.
and, of course, all the others :)