Walmart
Price
Debate sobre WMT
Puestos
153Walmart Q2 Earnings Highlights
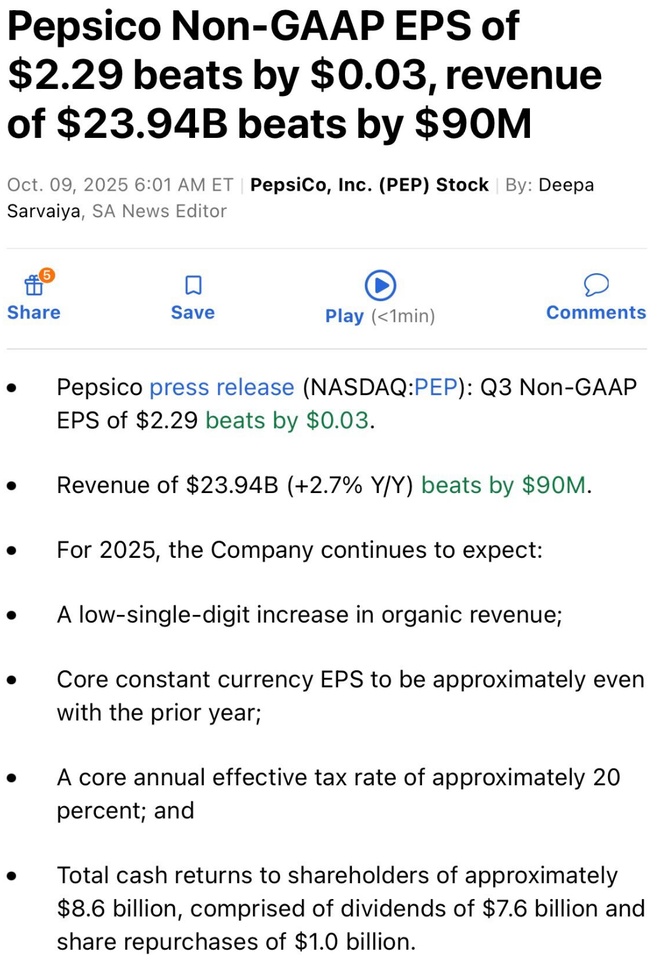
🔹 Revenue: $177.4B (Est. $174.4B) 🟢; +4.8% YoY (+5.6% cc)
🔹 Adj. EPS: $0.68 (Est. $0.74) 🔴; -8% YoY
Guidance
🔹 FY26 EPS: $2.52–$2.62 (Est. $2.64) 🔴
🔹 FY26 Net Sales: +3.75% to +4.75% cc (Prev. +3% to +4%) 🟢
🔹 Q3 EPS: $0.58–$0.60 (Est. $0.57) 🟢
Other Metrics
🔹 eCommerce Sales: +25% globally
🔹 Advertising Revenue: +46% globally; Walmart Connect U.S. +31%
🔹 Membership & Other Income: +5.4%; Membership Income +15.3% globally
🔹 Gross Margin: +4 bps, led by Walmart U.S.
🔹 Operating Income: DOWN -8.2% YoY; Adj. Operating Income +0.4% (cc)
🔹 EPS (GAAP): $0.88; includes $0.26 net gain from investments offset by legal/restructuring costs
🔹 ROA: 8.3%
🔹 ROI: 15.1%
Management Notes
🔸 Strong sales execution and growth in marketplace, membership, and advertising helped offset higher legal and restructuring costs.
🔸 Store-fulfilled pickup & delivery continues to drive eCommerce momentum.
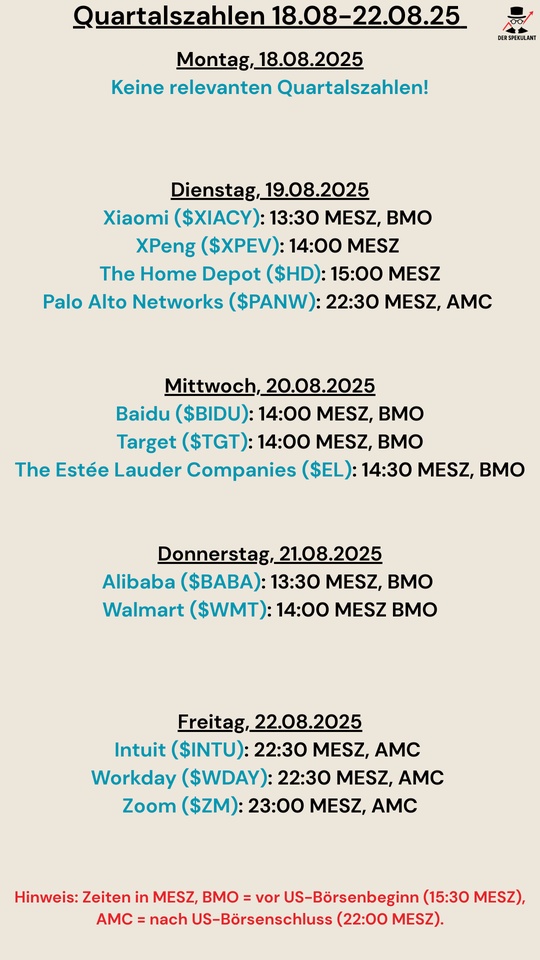
The week ahead 📅
>> Like, if you want a list like this every week.
MondayAugust 18, 2025:
- 08:00: Germany: Building permits (June) - indicator for construction activity.
- 11:00: Eurozone: Trade Balance (June) - Impact on EUR.
- 12:00: Germany: Bundesbank Monthly Report (August) - Monetary policy assessments.
- 16:00: USA: NAHB Housing Market Index (August) - leading indicator for the real estate sector.
- Corporate figures:
- Australia: BHP Group, annual figures (approx. 22:00).
- USA: Palo Alto Networks, Q4 figures (approx. 22:00).
TuesdayAugust 19, 2025:
- 08:00: Germany: Manufacturing order backlog/reach (June) - industrial activity.
- 10:00: Eurozone: ECB Current Account (June) - impact on EUR.
- 14:30: USA: Building Permits and Housing Starts (July) - housing market and economic sentiment.
- Corporate figures:
- Germany: Ceconomy, Hannover Re, K+S (approx. 07:00-08:00).
- USA: Home Depot, Q2 figures (approx. 12:00).
WednesdayAugust 20, 2025:
- 01:50: Japan: Trade Balance (July) - impact on JPY.
- 08:00: Germany: Producer prices (July) - inflationary pressure.
- 08:00: UK: Consumer prices (July) - signal for BoE policy.
- 16:30: USA: Crude Oil Inventories (week) - impact on oil prices.
- 20:00: USA: FOMC meeting minutes (July 29/30) - Fed interest rate policy.
- Corporate figures:
- Germany: Brenntag, E.ON, Porsche Automobil Holding (approx. 07:00-08:00).
ThursdayAugust 21, 2025:
- 09:15: France: Manufacturing/Services PMI (August, preliminary) - economic activity.
- 09:30: Germany: PMI Manufacturing/Services (August, preliminary) - Economic activity.
- 10:00: Eurozone: PMI Manufacturing/Services (August, preliminary) - Economic activity.
- 10:30: UK: PMI Manufacturing/Services (August, preliminary) - Economic Activity.
- 14:30: USA: Initial Jobless Claims (week) - Labor Market Health.
- 14:30: USA: Philadelphia Fed Business Outlook (August) - Regional Economic Indicator.
- 16:00: USA: Existing Home Sales (July) - Real Estate Market.
- 16:00: Eurozone: Consumer Confidence (August, preliminary) - Consumer Sentiment.
- Corporate figures:
- Germany: Hapag-Lloyd, LANXESS, HHLA (approx. 07:00-08:00).
- UK: Aviva, H1 figures (approx. 08:00).
- USA: Walmart, Q2 figures (approx. 13:00); Intuit, Q4 figures (approx. 22:00).
FridayAugust 22, 2025:
- 02:30: Japan: Jibun Bank PMI Manufacturing/Services (August, preliminary) - economic activity.
- 08:00: Germany: GDP (Q2, 2nd release) - economic activity.
- 08:00: UK: Retail Sales (July) - Consumer Behavior.
- 16:00-18:00 (expected): USA: Fed Chair Powell, speech at Jackson Hole - monetary policy.
- Corporate figures:
- Finland: Fortum, Q2 figures (approx. 08:00).
- Germany: H&R, mobilezone (approx. 07:00-08:00).
#FinX
$BHP (+1,85 %)
$HD (+2,45 %)
$WMT (-2,04 %)
$HLAG (+0,29 %)
$PAH3 (+1,29 %)
$FORTUM (+0,46 %)
$FOJCY
$LXS (+1,52 %)
$AV. (-0,95 %)
Depot July 2025: My figures and impressions
Midsummer should be in full swing in July, but summer prefers to take a breather. While the temperatures outside were rather cool for most of July, which fortunately didn't keep me from swimming and hiking, it was hot in the depot. Time for a look back.
Overall performance
In July, the portfolio made a significant leap upwards, possibly due to further crypto adoption, good labor market data, robust quarterly reports and a further decline in inflation in a positive environment. The big icing on the cake is of course the continued incoming cash flow from dividends and distributions. My key performance indicators are:
- TTWROR (month of July): +3.82 % (previous month: +0.19 %)
- TTWROR (since inception): +72,72 %
- IZF (month of July): +46.14 % (previous month: 2.47 %)
- IZF (since inception): +10,87 %
- Delta: +€2,468.62
- Absolute change: +€3,677.52
Performance & volume
Size of individual share positions by volume in the overall portfolio:
- Share: Share of total portfolio in % (securities account)
- $AVGO (+0,59 %) 2.98 % (main share portfolio)
- $NFLX (-1,14 %) 1.92 % (main share portfolio)
- $WMT (-2,04 %) 1.72 % (main share portfolio)
- $FAST (+1,29 %) 1.64 % (main share portfolio)
- $SAP (-0,17 %) 1.49 % (main share portfolio)
Smallest individual share positions by volume in the overall portfolio:
- Share: Share of total portfolio in % (custody account)
- $SHEL (+0,18 %) : 0.44 % (crypto follow-on portfolio)
- $NOVO B (+2,41 %) 0.45 % (main share portfolio)
- $HSBA (-0,18 %) 0.53 % (crypto follow-on portfolio)
- $GIS (-0,44 %) 0.60 % (main share portfolio)
- $TGT (+0,94 %) 0.64 % (main share portfolio)
Top-performing individual stocks
- Share: Performance since first purchase % (securities account)
- $AVGO (+0,59 %) +299 % (main share portfolio)
- $NFLX (-1,14 %) +174 % (main share portfolio)
- $FAST (+1,29 %) +86 % (main share portfolio)
- $SAP (-0,17 %) : +83 % (main share portfolio)
- $MAIN (-1,78 %) +82 % (main share portfolio)
Flop performer individual shares
- Share: Performance since first purchase % (securities account)
- $GIS (-0,44 %) -33 % (main share portfolio)
- $TGT (+0,94 %) -30 % (main share portfolio)
- $NOVO B (+2,41 %) -27 % (main share portfolio)
- $UPS (+2,05 %) -24 % (main share portfolio)
- $CPB (+0,82 %) -23 % (main share portfolio)
Asset allocation
My asset allocation is as follows:
- ETFs: 38.3 %
- Equities: 59.0 %
- Crypto: 2.60%
- P2P: less than 0.01%
Investments and subsequent purchases
Here is a small overview of what I have invested via savings plans according to my fixed planning.
- Planned savings plan amount from the fixed net salary: €1,030
- Planned savings plan amount from the fixed net salary, incl. reinvested dividends: €1,140
- Savings ratio of the savings plans to the fixed net salary: 49.75
In addition, there were the following additional investments from returns, refunds, cashback, etc. as one-off savings plans/repurchases:
- Repurchases/one-off savings plans as cashback annuities from refunds: € 70.77
- Subsequent purchases from other surpluses: € 135.00
- Automatically reinvested dividends by brokers: € 4.04 (Function is only activated for an old custody account, as I control the reinvestment myself)
Additional purchases were made:
- Number of additional purchases: 3
- 61.96 € for $SPYD (+0,26 %)
58.00 € for $GGRP (+0,7 %)
90.00 € for $JEGP (+0,08 %)
If you want to know how my cashback pension tops up my share and ETF pension, please let me know.
Passive income from dividends
My income from dividends amounted to € 222.47 (€ 93.27 in the same month last year). This corresponds to an increase of +138,52 % compared to the same month last year. The following are further key figures on the distributions:
- Number of dividend payments: 28
- Number of payment days: 12 days
- Average dividend per payment: € 7.95
- average dividend per payment day: € 18.54
The top payers are:
My passive income from dividends (and some interest) mathematically covered 27.12% of my expenses in the month under review.
Crypto performance
My crypto investments have also moved:
- Monthly performance portfolio: +9.49
- Performance since inception: +114.72 %
- Proportion of holdings for which the tax holding period has expired: 98.55%. Accordingly, there was one subsequent purchase in the month under review $ADA (-0,8 %) ).
- Crypto share of the total portfolio: 2.60 %
Crypto remains exciting for me. Due to many external influences (ETF inflows, treasury companies, Genius and Clarity Act, ...), the question arises as to whether the cycle theory is beginning to falter. Or not? Will it be different this time?
Performance comparison: portfolio vs. benchmarks
A comparison of my portfolio with two important ETFs shows:
- TTWROR (current month): +3,28 %
- Vanguard FTSE All World Dist ETF: +5.23 %
- Vanguard S&P 500 Dist ETF: +6.41 %
Outlook and conclusion
Crypto remains exciting for me. Due to many external influences (ETF inflows, treasury companies, Genius and Clarity Act, ...), the question arises as to whether the cycle theory is beginning to falter. Or not? Will it be different this time?
👉 You want my review as an Instagram post?
Then follow me on Instagram:
📲 In addition to the portfolio and budget review, you'll also find regular posts there: @frugalfreisein
👉 How was your July at the depot? Do you have any tops & flops to report?
Leave your thoughts in the comments!

My vision for the depot of the future 👀
A portfolio that supports long-term, solid growth and remains balanced. The focus is on global diversification, strong dividend payers, stable industry leaders and a targeted admixture of future-oriented stocks, including in the crypto sector.
✅ = already available
👀 = on the watchlist, interesting in terms of price soon
❌ = not yet interesting in terms of price at present
ETF selection
- FTSE All World ✅ = Global basis, broadly diversified. $VWRL (+0,44 %)
MSCI World Tech ✅ = Focus on innovative technology stocks.- Defense USD 👀 = Stability through defense and security.
- FTSE High Dividend 👀 = Dividend-oriented addition.
Single stock focus
Energy & commodities:
Shell ✅, Chevron 👀, Exxon 👀, Rio Tinto ❌ $SHEL (+0,18 %)
$CVX (+0,72 %)
$XOM (+0,76 %)
$RIO (-0,17 %)
Insurers & reinsurers:
Munich Re ✅, Hannover Re ✅, Swiss Re ❌, Allianz ❌, Swiss Life AG ❌ $ALV (-0,28 %)
$SREN (-0,08 %)
$SLHN (-0,8 %)
$HNR1 (-0,7 %)
$MUV2 (-0,91 %)
Finance & payment transactions:
Brown & Brown ✅, Marsh & McLennan ✅, Visa ✅, Mastercard ❌, PayPal 👀 $PYPL (+2,38 %)
$BRO (-0,72 %)
$MMC (-1,25 %)
$V (+0,74 %)
$MA (+0,33 %)
Technology & data:
Alphabet 👀, NVIDIA ❌ , Palantir ❌,
Amazon 👀, Apple ❌, Microsoft ❌, Baidu 👀 $9888 (+1,68 %)
$AAPL (+0,28 %)
$GOOGL (+2,32 %)
$PLTR (+1,15 %)
$NVDA (+0,78 %)
Health & consumption:
Novo Nordisk 👀, Zoetis 👀, Coca-Cola ❌, Walmart 👀, United Health 👀 $UNH (+0,36 %)
$NOVO B (+2,41 %)
$ZTS (-0,34 %)
$KO (-1,66 %)
$WMT (-2,04 %)
Automotive & Mobility:
BMW ❌, Mercedes 👀, Tesla ❌ $TSLA (+5,25 %)
$BMW (+0,96 %)
$MBG (+1,75 %)
Cryptos
- XRP ✅ $XRP (-0,11 %)
RENDER ✅ $RENDER (-2,07 %)
Bitcoin (BTC) ❌ $BTC (-0,23 %)
Solana (SOL) 👀 $SOL (+1,59 %)
Ethereum (ETH) ❌ $ETH (+1,3 %)
For the weekend
Strategy remains: Patience, discipline and an eye for opportunities.
📈🌾
PS: You still need a cool name for the portfolio.
Depot review June 2025 - My investment month in figures & thoughts
The start of summer in June combined sport and leisure for me. By that I mean swimming, hiking, running and sport at home. Apart from the incoming dividends, I hardly noticed anything on the stock market. It was not the strongest distribution month due to the postponement of three distributions, but it was still a very strong one. Time for a review.
Overall performance
The portfolio tended to tread water in June, but that is no cause for concern. Bit by bit, it is fighting its way out of the lows of the customs conflict. And cash flow continues to be generated by distributions to the clearing accounts. The key performance indicators are:
- TTWROR (month of May): +0.19 %
- TTWROR (since inception): +65,45 %
- IZF (month of May): +2.47 %
- IZF (since inception): +10,21 %
- Delta: +€148.63
- Absolute change: +1,173.63 €
Share allocation & performance
Which shares performed particularly well in June? Which are at the top and which at the bottom of the rankings? Which were the biggest losers?
Size of individual share positions by volume
- Share: Share of total portfolio in % (securities account)
- $AVGO (+0,59 %) 2.78 % (main share portfolio)
- $NFLX (-1,14 %) 2.20 % (main share portfolio)
- $WMT (-2,04 %) 1.71 % (main share portfolio)
- $SAP (-0,17 %) 1.59 % (main share portfolio)
- $FAST (+1,29 %) 1.55 % (main share portfolio)
Smallest individual share positions by volume:
- Share: Share of total portfolio in % (securities account)
- $SHEL (+0,18 %) 0.44 % (crypto follow-on portfolio)
- $HSBA (-0,18 %) 0.54 % (crypto follow-on portfolio)
- $TGT (+0,94 %) 0.62 % (main share portfolio)
- $GIS (-0,44 %) 0.63 % (main share portfolio)
- $CPB (+0,82 %) 0.64 % (main share portfolio)
Top-performing individual shares
- Share: Performance since first purchase % (securities account)
- $AVGO (+0,59 %) : +261 % (main share portfolio)
- $NFLX (-1,14 %) : +198 % (main share portfolio)
- $SAP (-0,17 %) +106 % (main share portfolio)
- $WMT (-2,04 %) : +68 % (main share portfolio)
- $RSG (-1,82 %) +47 % (main share portfolio)
Flop performer individual shares
- Share: Performance since first purchase % (securities account)
- $DHR (+2,85 %) -57 % (main share portfolio)
- $CPB (+0,82 %) -42 % (main share portfolio)
- $TGT (+0,94 %) -37 % (main share portfolio)
- $GIS (-0,44 %) -36 % (main share portfolio)
- $NKE (+2,12 %) -30 % (main share portfolio)
ETFs vs. shares
The breakdown of ETFs vs. shares across all portfolios is 38.7% to 61.3%. This differs from the breakdown of my ETFs to equities savings plans (43% to 57%). Equities have performed better, which is due to the fact that I also include high-dividend ETFs in the ETFs.
Investments and additional purchases
Here is a brief overview of what I have invested in savings plans according to my fixed planning.
- Planned savings plan amount from the fixed net salary: €1,030
- Planned savings plan amount from the fixed net salary, with reinvested dividends: €1,140
- Savings ratio of the savings plans to the fixed net salary: 49.75
In addition, there were the following additional investments from returns, refunds, cashback, etc. as one-off savings plans/repurchases:
- Subsequent purchases/one-off savings plans as cashback annuity from refunds: € 32.32
- Automatically reinvested dividend by broker: € 7.25 (Function is only activated for an old custody account, as I want to control the reinvestment myself)
Additional purchases were made from other surpluses:
- Number of additional purchases: 2
- 25.00 € for $FGEQ (+0,58 %)
There were no additional purchases from the components of my cashback pension (e.g. reimbursements from health insurance premiums, insurance premiums, shopping vouchers, etc.) this month.
If you would like to know how my cashback pension supplements my equity and ETF pension, please let me know.
Passive income from dividends
My income from dividends amounted to € 152.30 (€ 179.04 in the same month last year). This corresponds to an increase of -14.94 % compared to the same month last year. The following is further key data on the distributions:
- Number of dividend payments: 31
- Number of payment days: 15 days
- Average dividend per payment: € 4.91
- average dividend per payday: € 10.15
The top payers are:
My passive income from dividends (and some interest) mathematically covered 15.91% of my expenses in the month under review.
Crypto performance
My crypto investments also moved a little:
- Monthly performance portfolio: +3.81 %
- Performance since inception: +79.49 %
- Proportion of holdings for which the tax holding period has expired: 100%. This means that there have been no additional purchases for over a year.
- Crypto share of the total portfolio: 2.19 %
I find the topic exciting, but it is very underrepresented in my overall portfolio due to my passive income strategy. The first profits have already been realized and more will definitely follow. For me, crypto is a lever to turn play money into even more play money, which is then put into the solid distributors to make the income snowball grow bigger and bigger. New accumulation will take place in the coming bear market.
Performance comparison: portfolio vs. benchmarks
A comparison of my portfolio with two important ETFs shows:
- TTWROR (current month): +0.19 %
- $VWRL (+0,44 %) : +0.39 %
- $VUSA (+0,49 %) : +1.24 %
Outlook and conclusion
I'm using the summer, which has already begun, not only for hiking, but also for city trips for my "non-financial" TikTok and Insta channel. I can often be found at one of the lakes near Leipzig, which were once created from the open-cast mining pits of the brown coal era. It's nice that the lunar landscapes have become a local recreation area. That's why I'm less active at the moment. That will certainly change again in the fall.
For now, I'm just enjoying life, and my money continues to work stubbornly and steadily for me in the background. Current events in the world and in politics don't interest me in the slightest. As I write this review, the first third of the summer will soon be over.
👉 You want my review as an Instagram post?
Then follow me on Instagram:
📲 You'll find regular posts there as well as the portfolio and budget review: @frugalfreisein
How did your June at the depot go? Do you have any tops & flops to share? Leave your thoughts in the comments!
Entry times
Hello everyone,
I would be interested to know what amount (in €) you would invest in the following shares? The companies are certainly also suitable for savings plans. However, I would like to have a "starting position" first.
You are also welcome to use this as a suggestion for discussion in the comments ✌🏽
Best wishes and a good start to the stock market tomorrow 🖖🏽
Depot review May 2025 - My investment month in figures & thoughts
BEFORE: I have completely revised my portfolio review. There are now even more in-depth figures to see and I have greatly reduced the body text. Only my introduction is a little more detailed. The visual overview on Instagram has also been completely revamped. There is also a budget review, which I am not publishing here as a post. However, I have included a few key figures from this one in the portfolio review.
I am very happy about likes here at GQ and on both IG posts, as the complete renewal has cost me a lot of nerves and time. 🙃 If you also want to know how my personal finances have developed, I'd like to refer you to my personal budget review on Instagram.
In future, I will publish my detailed assessments on individual topics that were previously part of the review (such as crypto cycles or my succession strategy for crypto) separately in individual posts on GQ. Perhaps as a kind of supplementary post.
Are you missing important key figures or do you have suggestions for optimization? Constructive suggestions are always welcome.
For me, May was characterized by calm and composure, because I kept the noise of the markets and US trade policy away from me. I can do no more than simply buy more. I like to refer here to the stoic way of thinking, which focuses on prioritizing what you can influence. And that is my personal development. So that meant doing sport (at home with YouTube cardio and strength, abs, core, running), stockpiling Instagram posts so that I have some breathing space in the summer and delving deeper into the topic of AI. And the tax return was also completed. Meanwhile, dividends have been stable with the second strongest month ever, which was April. Time for a deep dive into my figures.
Overall performance
My portfolio performed well in May. Bit by bit, we are fighting our way up from the tariff lows. The key performance indicators are
- TTWROR (month of May): +4.83 %
- TTWROR (since inception): +65.84 %
- IZF (month of May): +74.24 %
- IZF (since inception): +9.94 %
- Delta: +€3,368.39
- Absolute change: +4,486.96 €
Share allocation & performance
Which shares performed particularly well in May? Which are at the top of the chain and which at the bottom? Which were the biggest losers?
Size of individual share positions by volume
Share: Share of total portfolio in % (portfolio)
- $AVGO (+0,59 %) : 2,71 % (main share portfolio)
- $NFLX (-1,14 %) : 2,12 % (main share portfolio)
- $WMT (-2,04 %) : 1,83 % (main share portfolio)
- $SAP (-0,17 %) : 1,69 % (main share portfolio)
- $FAST (+1,29 %) : 1,59 % (main share portfolio)
Smallest individual share positions by volume:
Share: Share of total portfolio in % (securities account)
- $SHEL (+0,18 %) : 0,44 % (crypto follow-on portfolio)
- $HSBA (-0,18 %) : 0,54 % (crypto follow-on portfolio)
- $TGT (+0,94 %) : 0,62 % (main share portfolio)
$DHR (+2,85 %) : 0,66 % (main share deposit)
$NKE (+2,12 %) : 0,67 % (main share portfolio)
Top-performing individual shares
Share: Performance since first purchase % (securities account)
- $AVGO (+0,59 %) : +245 % (main share portfolio)
- $NFLX (-1,14 %) : +190 % (main share portfolio)
- $SAP (-0,17 %) : +108% (main share portfolio)
- $WMT (-2,04 %) : +79% % (main share portfolio)
- $RSG (-1,82 %) : +60 % (main share portfolio)
Flop performer individual stocks
Share: Performance since first purchase % (securities account)
- $DHR (+2,85 %) : -58 % (main share portfolio)
- $TGT (+0,94 %) : -40 % (main share portfolio)
- $NKE (+2,12 %) : -39 % (main share portfolio)
- $CPB (+0,82 %) : -34 % (main share portfolio)
- $UPS (+2,05 %) : -30 % (main share portfolio)
ETFs vs. shares
The breakdown of ETFs vs. shares across all portfolios is 38.8% to 61.2%. This differs slightly from the breakdown of my ETFs to equities savings plans (43% to 57%).
Investments and subsequent purchases
Here is a small overview of what I have invested via savings plans according to my fixed planning.
- Planned savings plan amount from the fixed net salary: €1,030
- Planned savings plan amount from the fixed net salary, with reinvested dividends: €1,140
- Savings ratio of the savings plans to the fixed net salary: 49.75
In addition, there were the following additional investments from returns, refunds, cashback, etc. as one-off savings plans/repurchases:
- Subsequent purchases as a cashback annuity from refunds: € 70.50
- Dividend automatically reinvested by broker: € 2.99
Additional purchases: as one-off savings plans as part of my cashback pension, reinvested discounts from previous grocery and drugstore purchases and a refund from the health insurance bonus program.
- Number of additional purchases: 2
- 30.00 € for $JEGP (+0,08 %)
40.50 € for $GGRP (+0,7 %)
If you want to know how my cashback pension tops up the share and ETF pension, please let me know.
Passive income from dividends
My income from dividends amounted to € 163.13 (€ 89.68 in the same month last year). This corresponds to an increase of +42.32 % compared to the same month last year. The following is further key data on the distributions:
- Number of dividend payments: 11
- Number of payment days: 21 days
- Average dividend per payment: € 14.83
- average dividend per payment day: € 7.72
The top payers are:
My passive income from dividends (and some interest) mathematically covered 21.08% of my expenses in the month under review.
Crypto performance
My crypto investments also moved a little:
- Monthly performance portfolio: +0.72%
- Performance since inception: +70.90%
- Proportion of holdings for which the tax holding period has expired: 100%. This means that there have been no additional purchases for over a year.
- Crypto share of the total portfolio: 2.23%
I find the topic exciting, but it is very underrepresented in my overall portfolio due to my strategy. Profits have long since been realized, my focus here has long been elsewhere. Accumulation will take place in the coming bear market.
Performance comparison: portfolio vs. benchmarks
A comparison of my portfolio with two important ETFs shows:
- TTWROR (current month): +4.83%
- $VWRL (+0,44 %) +6.10%
- $VUSA (+0,49 %) : +6.89%
Outlook and conclusion
According to the tax estimate, I can expect a tax refund. When this arrives, part of it will be donated and the rest will of course be reinvested. May was also a no-spend month for me and, as a convinced frugalist, this went off without a hitch. I was able to reflect more closely on my spending behavior and even found further potential despite my basic low spend attitude. Now I'm preparing a Hartz IV/citizen's allowance experiment for at least 3-4 months (or more) for the second half of the year. Simply because I feel like challenging myself. My planned expenses and provisions according to the budget only just exceed my theoretical entitlement to citizen's allowance. More info coming soon on Instagram. After March and April, I was again able to record expenses of less than €1,000 per month in May. This will change in June due to a large annual insurance premium, but maybe I'll be lucky and stay at a maximum of €1,100 to €1,200. As in the previous months, I will continue to use the early summer in June for hiking, swimming and day trips.
👉 You want my review as an Instagram post?
Then follow me on Instagram:
📲 As well as the depot and budget review, there's also: @frugalfreisein
- One-pagers and carousel posts every Monday, Wednesday and Friday on topics such as wealth accumulation, frugalism and minimalism
- more story insights in the future
- Mindset, motivation & money-saving life hacks for your own journey
How was your May at the depot? Do you have any tops & flops to share? Leave your thoughts in the comments!
Have a nice vacation, Beer challenge, Memories
Hello Getquins,
As always, I'm starting my summer a little early with a vacation. This time it's not Asia but surprisingly :-) the USA.
As it's my first vacation in this country (otherwise only on business) I'm taking advantage of other opportunities, not just the company and hotel.
$ROST (-1,91 %) The shares of the company are very strong here and were not known to me as a share, the turnover, profit and share price in the past are very lucrative.
My investment $PEP (-0,51 %) I hardly see here except for sweets like Lay Chips but $KO (-1,66 %) is the leading beverage here.
I have $TSLA (+5,25 %) and am surprised at the company empire, the South African is doing (almost) everything right. His company Space X (now also rockets), the Boring Company opposite and batteries under construction for houses, companies and cities are a large portfolio.
They build like mad here, whether streets $CAT (+3,33 %)
$DE (+0,53 %) or entire residential areas with several hundred houses.
The integration of South Americans has been properly implemented here, you can see them working in construction, with the cleaning crew or as handymen in the trades. Whether this will work in Europe with state support is questionable, but it's a different topic.
Almost 90% of people here have $AAPL (+0,28 %) iphone, $F (+2,25 %) pickups or $GM (+2,09 %) a few European ones can also be seen here $VOW (+1,11 %)
$BMW (+0,96 %)
The bar culture, restaurants and dinners are very popular.
Of course there is a huge $WMT (-2,04 %) and next to it the $CVS (-1,49 %)
Best regards and hope you had Easter or soon Whitsun vacation.
So long
Smudo


+ 6

Valores en tendencia
Principales creadores de la semana