Disney
$DIS (+1,22 %) and ESPN are testing a generative AI avatar called "FACTS".
This AI bot uses data from ESPN Analytics to provide analytics and is intended to complement the hosts of the SEC Nation show on ESPN, reports The Verge.
Puestos
237Disney
$DIS (+1,22 %) and ESPN are testing a generative AI avatar called "FACTS".
This AI bot uses data from ESPN Analytics to provide analytics and is intended to complement the hosts of the SEC Nation show on ESPN, reports The Verge.
Analyst updates, 19.11.
⬆️⬆️⬆️
- JEFFERIES raises the price target for NETFLIX from USD 800 to USD 1000. Buy. $NFLX (+0,88 %)
- DEUTSCHE BANK RESEARCH raises the price target for SIEMENS from EUR 200 to EUR 210. Buy. $SIE (+0,7 %)
- DZ BANK raises the price target for WALT DISNEY from USD 115 to USD 130. Buy. $DIS (+1,22 %)
- KEPLER CHEUVREUX raises the target price for ALZCHEM from EUR 69 to EUR 73. Buy. $ACT (-0,66 %)
⬇️⬇️⬇️
- BOFA downgrades SIEMENS from Buy to Neutral and raises target price from EUR 196 to EUR 200. $SIE (+0,7 %)
- BERENBERG lowers the price target for BAYER from EUR 28 to EUR 22. Hold. $BAYN (+1,36 %)
- BERENBERG lowers the price target for SMA SOLAR from EUR 21 to EUR 14. Hold. $S92 (+2,06 %)
- DZ BANK downgrades SHOPIFY from Hold to Sell and raises target price from USD 68 to USD 91. $SHOP (+1,18 %)
- STIFEL lowers the price target for BECHTLE from EUR 50 to EUR 45. Buy. $BC8 (-0,12 %)
- WARBURG RESEARCH lowers the price target for JUNGHEINRICH from EUR 49 to EUR 47. Buy. $JUN3 (+0,12 %)
- HAUCK AUFHÄUSER IB lowers the target price for KNAUS TABBERT from EUR 16 to EUR 8. Sell. $KTA (+11,19 %)
- DEUTSCHE BANK RESEARCH lowers the price target for JOST WERKE from EUR 70 to EUR 60. Buy. $JST (+0,48 %)
- GOLDMAN lowers the price target for TEAMVIEWER from EUR 18 to EUR 17. Buy. $TMV (+0,22 %)
Analyst updates, 15.11. 👇🏼
⬆️⬆️⬆️
- JEFFERIES raises the price target for ASML from EUR 760 to EUR 840. Buy. $ASML (+0,8 %)
- RBC raises the price target for TESLA from USD 249 to USD 313. Outperform. $TSLA (+4,29 %)
- JPMORGAN raises the price target for WALT DISNEY from USD 125 to USD 128. Overweight. $DIS (+1,22 %)
- JPMORGAN raises the price target for SIEMENS from EUR 215 to EUR 230. Overweight. $SIE (+0,7 %)
- BARCLAYS raises the target price for SIEMENS ENERGY from EUR 21 to EUR 35. Equal-Weight. $ENR (+2,43 %)
- LBBW raises the target price for EON from EUR 13.80 to EUR 13.90. Buy. $EOAN (+3,48 %)
- HAUCK AUFHÄUSER IB raises the target price for ADESSO from EUR 80 to EUR 85. Hold. $ADN1 (-2,82 %)
- DEUTSCHE BANK RESEARCH raises the target price for BURBERRY from GBP 7.40 to GBP 8.60. Hold. $BRBY (+2,91 %)
- BERENBERG raises the price target for TALANX from EUR 76.20 to EUR 91.10. Buy. $TLX (+1,59 %)
- BERENBERG raises the price target for HAPAG-LLOYD from EUR 163 to EUR 169. Hold. $HLAG (+0,28 %)
⬇️⬇️⬇️
- JPMORGAN lowers the price target for BAYER from EUR 34 to EUR 25. Neutral. $BAYN (+1,36 %)
- SANTANDER downgrades SHELL from Neutral to Outperform and lowers target price from GBP 30.50 to GBP 30. $SHEL (+0,64 %)
- WARBURG RESEARCH lowers the price target for SECUNET from EUR 216 to EUR 210. Buy. $YSN (+8,67 %)
- METZLER lowers the price target for SIXT-STÄMME from EUR 105 to EUR 95. Buy. $SIX2 (+1,28 %)
- ODDO BHF lowers the target price for MERCK KGAA from EUR 187 to EUR 176. Outperform. $MRK (-0,21 %)
- METZLER lowers the price target for SMA SOLAR from EUR 20 to EUR 16. Hold. $S92 (+2,06 %)
- DEUTSCHE BANK RESEARCH lowers the price target for GRENKE from EUR 28 to EUR 24. Buy. $GLJ (+1,5 %)
- BERENBERG lowers the target price for K+S from EUR 15.70 to EUR 14.70. Buy. $SDF (+0,58 %)
- BERENBERG lowers the price target for AUMANN from EUR 17 to EUR 14.50. Hold. $AAG (+2,72 %)
- BERENBERG lowers the price target for DERMAPHARM from EUR 58 to EUR 50. Buy. $DMP (+1,28 %)
- BARCLAYS lowers the price target for SYMRISE from EUR 123 to EUR 115. Equal-Weight. $SY1 (+1,72 %)
Disney $DIS (+1,22 %) has announced its quarterly figures.
The earnings per share (EPS) amounted to $1,14 and exceeds expectations of $1,10.
The turnover amounted to $22,57 billion and is also above the expectations of $22,35 billion.
Walt Disney $DIS (+1,22 %) reported 4th quarter EPS of $1.14, $0.04 more than the analyst estimate of $1.10.
Revenue for the quarter totaled $22.6B, compared to average estimates of $22.48B.
Walt Disney shares ended official trading day at the closing price of $102.72. In the last 3 months the performance was plus 15.03%, in the last 12 months plus 9.36%
---------------------------------------------------------------------------------------------------
As of $DIS (+1,22 %) Disney’s fiscal Q4 earnings call for 2024, held on November 14, Disney reported both positive and challenging results across its diverse business segments. Revenue was $22.47 billion, slightly lower than the $23.16 billion in the previous quarter, reflecting some expected seasonal declines. However, Disney achieved profitability in its streaming division, which includes Disney+, ESPN+, and Hulu, marking a significant milestone. This success was supported by subscriber growth and increased subscription prices, although operating costs rose due to content investments and increased marketing.
In the traditional media segment, Disney’s Linear Networks faced a 5% revenue decline, largely due to continued subscriber losses and softer advertising revenue. However, operating income from this segment increased by 6%, aided by reduced costs in sports programming.
Additionally, Disney’s theme parks and experiences segment grew moderately, with revenue increasing by 2%. This growth was driven by increased attendance and spending at U.S. parks, though income was partially offset by decreased demand at international locations, especially at Disneyland Paris.
Looking forward, Disney is focused on strategic cost-saving initiatives, particularly within its content and direct-to-consumer segments, while continuing to pursue new growth in its media and parks segments. CEO Bob Iger highlighted Disney’s commitment to increasing profitability across all segments and hinted at potential new developments, including potential changes in content strategies and international expansion
$DIS (+1,22 %) | Walt Disney Q4 '24 Earnings Highlights:
🔹 EPS: $1.14 (Est. $1.10) 🟢; UP +39% YoY
🔹 Revenue: $22.6B (Est. $22.48B) 🟢; UP +6% YoY
🔹 Disney+ Core Paid Subscribers: 122.7M (Est. 119.85M) 🟢
FY25 Guidance:
🔹 Adj EPS Growth: High-single digit YoY (Est. +4%) 🟢
🔹 Cash from Operations: Approximately $15B
🔹 Capital Expenditures: Approximately $8B
🔹 Share Repurchases: Targeting $3B
🔹 Dividend Growth: Expected to track earnings growth
FY26 and FY27 Long-Term Guidance:
🔹 FY26 EPS Growth: Double digit
🔹 FY26 Cash from Operations: Double digit growth
🔹 FY27 EPS Growth: Double digit
Q4 Subscriber Metrics:
🔹 Disney+ Core Paid Subscribers: 122.7M (Est. 119.85M) 🟢; UP +4% QoQ
🔹 Hulu Total Subscribers: 52M (Est. 51.1M) 🟢; UP +2% QoQ
Q4 Segment Revenue:
🔸 Entertainment: $10.83B (Est. $10.66B) 🟢; UP +14% YoY
🔹 Linear Networks: $2.46B; DOWN -6% YoY
🔹 Direct-to-Consumer (DTC): $5.78B; UP +15% YoY
🔹 Content Sales/Licensing and Other: $2.59B; UP +39% YoY
🔸 Sports: $3.91B; FLAT YoY
🔹 ESPN Domestic: $3.49B; UP +1% YoY
🔹 Star India: $58M; DOWN -37% YoY
🔸 Experiences: $8.24B (Est. $8.2B) 🟢; UP +1% YoY
🔹 Domestic Parks & Experiences: $5.52B; UP +3% YoY
🔹 International Parks & Experiences: $1.58B; DOWN -5% YoY
🔹 Consumer Products: $1.14B; UP +2% YoY
Q4 Segment Operating Income:
🔸 Entertainment: $1.07B; UP >100% YoY, driven by:
🔸 DTC Operating Income: $253M; UP from a loss of $420M YoY, supported by higher ad revenue, increased retail pricing, and improved efficiency in Disney+
🔸 Content Sales/Licensing and Other: $316M; UP from a loss of $149M YoY, due to box office successes including Inside Out 2 and Deadpool & Wolverine
🔸 Linear Networks: $498M; DOWN -38% YoY, affected by reduced affiliate and advertising revenue and higher marketing costs
🔸 Sports: $929M; DOWN -5% YoY, impacted by:
🔹 Increased college football rights costs and reduced NFL game broadcasts
🔹 Lower affiliate revenue from fewer subscribers, partially offset by rate increases
🔹 Improved ad revenue due to higher rates and sponsorship
🔸 Experiences: $1.66B (DOWN -6% YoY), driven by:
🔹 Domestic Parks & Experiences: $847M; UP +5% YoY, supported by increased guest spending at parks and cruise lines
🔹 International Parks & Experiences: $299M; DOWN -32% YoY, affected by lower attendance and increased costs for new guest offerings
🔸 Consumer Products: $513M; UP +1% YoY
FY24 Summary:
🔹 Total Revenue: $91.4B; UP +3% YoY
🔹 Total Segment Operating Income: $15.6B; UP +21% YoY
🔹 Cash Provided by Operations: $13.97B; UP +42% YoY
🔹 Free Cash Flow: $8.56B; UP +75% YoY
Additional FY25 Segment-Specific Guidance:
🔹 Entertainment: Anticipates double-digit segment operating income growth, weighted towards the first half of the year
🔹 Sports: 13% segment operating income growth on a reported basis, though excluding India, operating income is expected to decline approximately 10%
🔹 Experiences: Projected segment operating income growth of 6%-8%, weighted to the second half of the year
Hello :)
I can't say yet if there will be a comeback here - but now I have some time to briefly introduce a trade I'm in or in which I'm increasingly going into should I get more bullish signals.
Currently I am still holding a $TSLA (+4,29 %) long from May $INTC (+1,17 %) from September (even if we are still a bit away from my entry here). $NTR (+1,35 %) Long from July (it should move!) and since October a $BA (+4,64 %) long - which I am now presenting!
Why is that $BA (+4,64 %) ? Well, a colleague at work has told me several times how bad the company is doing and that (to exaggerate) he expects it to go bankrupt next year. So I thought I'd take a look at the chart and lo and behold I found it quite attractive for a long ;).
As you know, I don't pay much attention to fundamental news, so I'm not interested in the bad news. With a few exceptions, everything is priced in before we hear about it and then I can see it in the chart anyway.
Briefly on the basic situation:
Corona crashed to 88$ then a nice rebound to 280$. That would give us our range for the last 3-4 years. Even due to Corona and the latest NASA news etc., we have never broken our breakout zone from the all-time high. We never broke our breakout zone from the all-time high. This means that we have always remained bullish in the monthly structure and higher.
What is my basic target for this trade? Breakout zone from Pre Corona. So 300-400$.
Why now ?
We are basically at the lower end of the range. That means basically in the discount zone. - Anyone who knows me knows that I only take trades from a discount zone - in other words, I always trade anti-cyclically and on trend changes after a clear confirmation. In other words, I don't buy into a bearish candle at random, but after we have already seen a structural change in the order flow.
In addition, we have reached a POC, i.e. a point of control (point of highest volume in a range). We still have a nice POC a little further down at around 133$ but that would break the order flow which would be so bearish that the trade is irrelevant for me anyway. (There is no perfect setup anyway).
We are currently accumulating nicely at the trendline and have obtained a bullish structure on the daily chart. At the beginning I said that I am not yet completely convinced - this is because we are currently still at the breakdown point - so we could expand downwards at any time with a strong downward impulse. However, if we now break the 160 mark again impulsively, this is a clear signal for me that the share wants more and I would then buy even more into my position on a correction.
The first and most difficult target is the 180$ mark. Here we have the point of control of the downward movement that came about after the last test of the range highs at 260$. Above 200 at the latest is practically no man's land and price discovery up to 260$.
So I set my stop loss at 180$ to +-0 (breakeven). If we break and close the range highs at 260$ impulsively with a weekly candle, the path to the target at 300$+ is clear.
Why do I think the trade is good at the moment and I am already in it without having broken the 165$ .... well, I just think the chart is good and wanted to open halfway. A lot comes with time simply by feeling and I have the chance here to set a tight stop loss and thus get a comparatively high R/R with high leverage. So I have a tight invalidation level. Earnings are now over and the news is therefore limited.
It is important to mention that my entry is a RISK ENTRY and a confirmation for me is actually only given from the break of 160$. Before that, anything can happen and it is normally just a watchlist position for me. (So exception)
Enclosed you will find my monthly, weekly and daily charts. Questions as always in the comments. I have probably written complete gibberish again.
PS. $DIS (+1,22 %) is currently on my watchlist.
If you have any great stocks on your watchlist - check them out. Due to $TSLA (+4,29 %) has freed up some liquidity, so I can enter into a few new swing trades.
Greetings Melon!
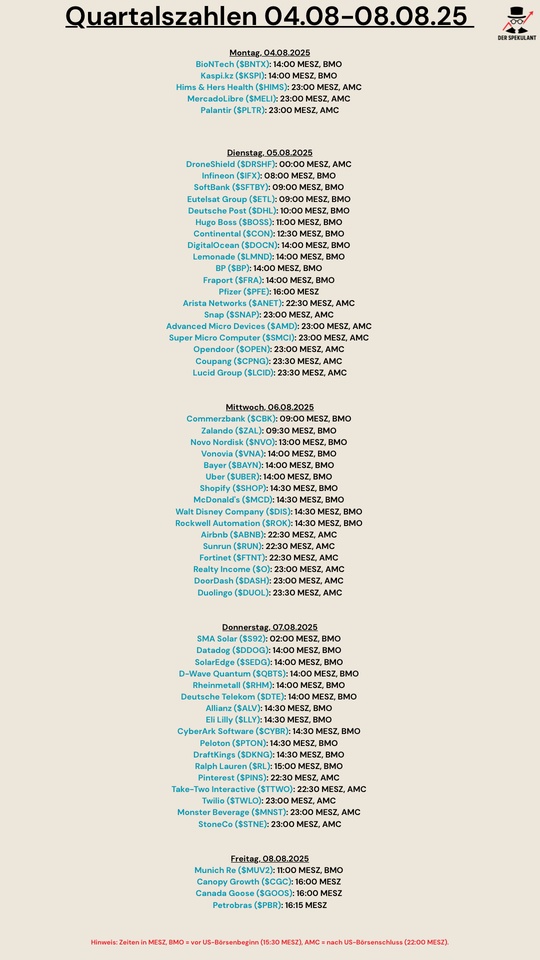
Earnings next week (11.11 - 15.11)
💭 Since the absurd increases of the past year, I have increasingly wondered: is it worth selling part of my portfolio? Stocks look increasingly overvalued, and I wonder if we haven't already reached the limit. How do you approach this? Do you take profits, stay put or switch to other investments? Curious about your thoughts! 💬
Also feel free to react on my positions!
$AMZN (+0,2 %)
$AAPL (+1,26 %)
$TSLA (+4,29 %)
$O (+0,55 %)
$ASML (+0,8 %)
$ATKR (+8,96 %)
$PYPL (+2,85 %)
$DIS (+1,22 %)
$AVHNY
$SOF (+1,46 %)
$UMICY
$IWDA (+1,13 %)
$EIMI (+1,11 %)
$XDEW (+1,55 %)
$
Principales creadores de la semana