1Mon.·

Bitcoin bewegt sich ähnlich wie vor 4 Jahren

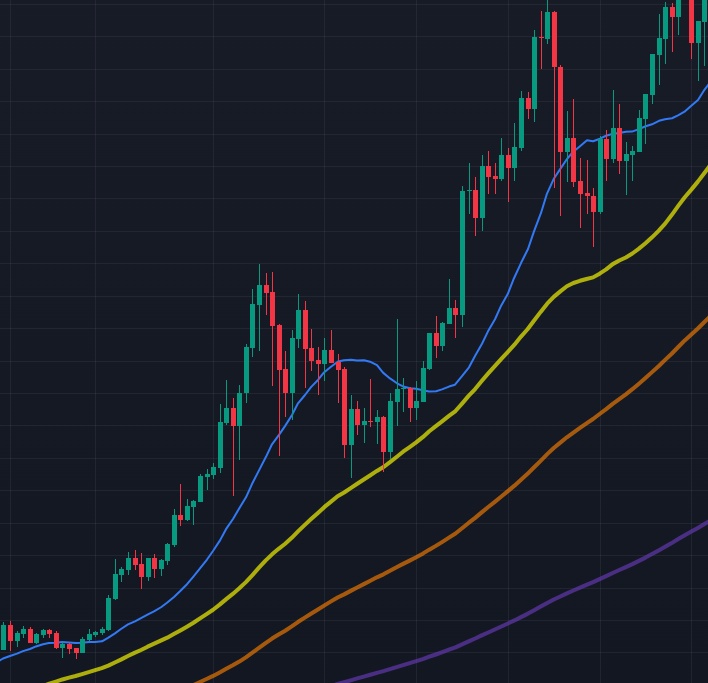
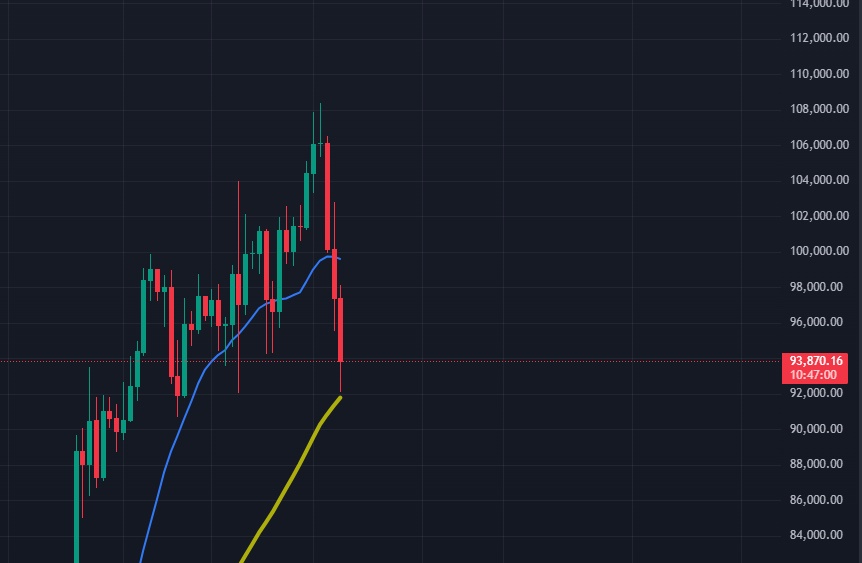
Im letzten Bullrun hat Bitcoin im Daily Chart mehrmals den 20 Day SMA (Blau) durchbrochen und die 50 Day SMA (Gelb) Grenze getestet. Wenn wir mehrere Tage über dem 50 Day SMA schließen, dann könnten wir ein ähnliches Verhalten des Bitcoin-Preises wie vor 4 Jahren sehen, bis es Januar und Februar wieder höher geht. So auf jeden Fall die Theorie aber natürlich ist nichts garantiert. Historische Muster werden auch gerne mal gebrochen.

Ich bleibe gespannt und beäugle einen (Nach)kauf bei $COIN (-2,4 %) , $MSTR (-1,08 %) und natürlich $BTC (-0,67 %)

(Not Financial Advice)

attachment
attachment
15
4 Kommentare

So we could see further drop next week?
2
Profilbild
@investingbeginner We are currently sitting just over the 50 SMA on the daily chart. In the last Bullrun this was always the end of the price drop. I can't tell you the future. I can show you historic patterns though.
2
Profilbild
Yes, it could drop more, but also it will give us another ATH before Trump, now we know the reps or the congress wont make It easy for Trump, so we should expect a rollercoaster but mostly to the upside
Profilbild
Werde Teil der Community