
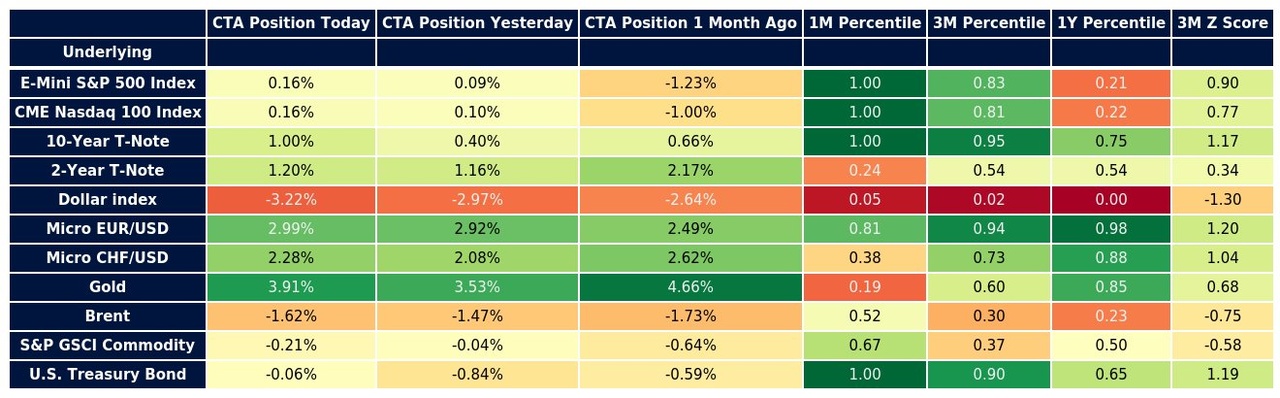
CTA clearly indicate that they are cautiously bullish on S&P500 & $NDAQ (-2,85 %) . The position is up 0.16%. The 1 month percentile is at 1, which was the highest level since last month. A cautious long position is opened.
Bonds look very long. The current position is 1%, which is also the highest level in a month. The value is also strongly long within 3 months (3MZ). The inflows in 10Y Treasuries point to a potential interest rate cut.
Looking at the dollar, the position is -3.22%, i.e. strongly short. The 1-year percentile is also at 0, which is historically the lowest value. A small indication that inflation is reducing the purchasing power of the dollar.
Gold is currently very strong at 3.91%. The rise is an indication that there is a risk of inflation.
Since I realize that a large number of people are not familiar with CTAs, I am currently working on a guide on how to interpret such values!

