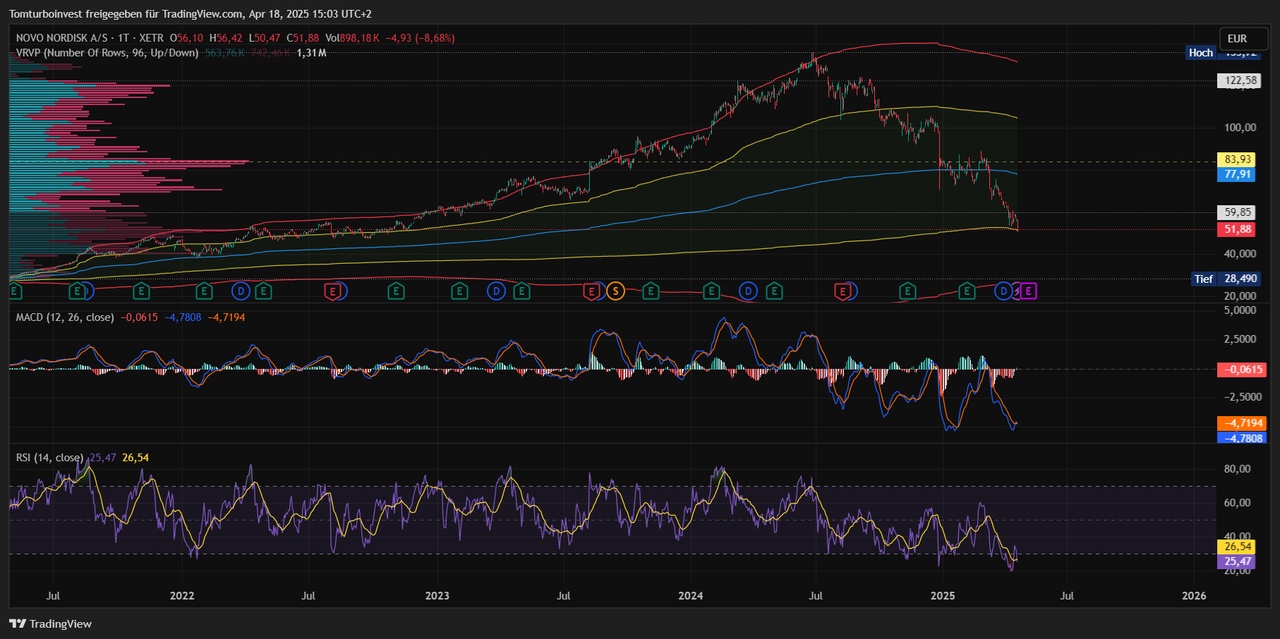
$NOVO B (+2,62 %) The chart shows the period from the strong price performance in March/April 2021. From this point onwards, the price was supported by strong momentum and closely followed the red line, which represents the second standard deviation of the VWAP (Volume Weighted Average Price). This second standard deviation ran quite parallel above the SMA50 until the trend reversed in July 2024.
The significant volume peaks were in the price ranges around € 51, € 70 and € 83. Numerous positions were built up between April and November 2022, particularly in the €51 range. The price is currently at the lower edge of the first standard deviation of the VWAPwhich lies exactly on one of these volume peaks. From a technical perspective, this could represent a strong support zone. The next few weeks, up to the earnings on 7 May, will show whether institutional investors defend their trades from this area.
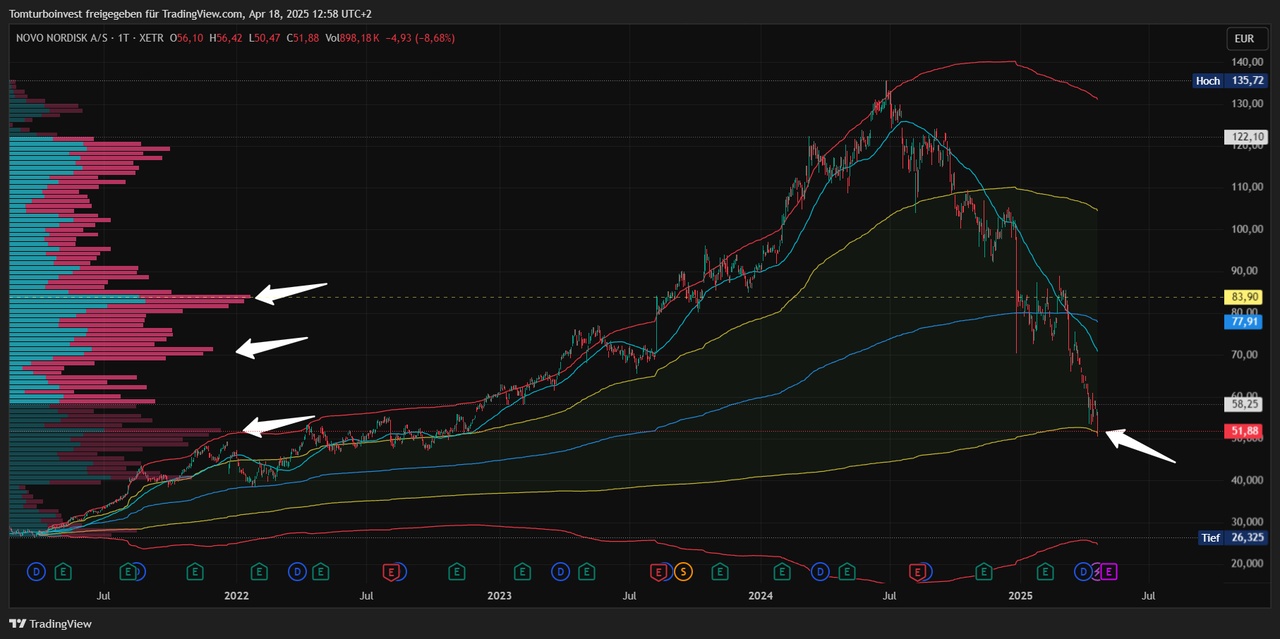
A positive scenario would be a bounce up to the next volume peak around € 70 or even beyond to above the VWAP (blue line). A negative scenario on the other hand, could mean a fall in the share price to around € 40.
After the share price reached the lower edge of the first standard deviation of the VWAP yesterday, I increased my Novo position by a further 10%. Despite the current price losses, which are likely to affect many investors, the fundamental figures make me optimistic about the future.
- Estimates for sales and EPS for the next few years are still rising
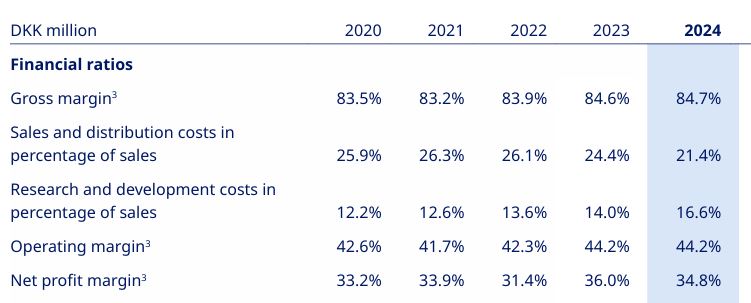
- P/E ratio, KUV and KBV are at the same levels as in 2018
- Gross margin is >80%, EBITDA margin >50%,
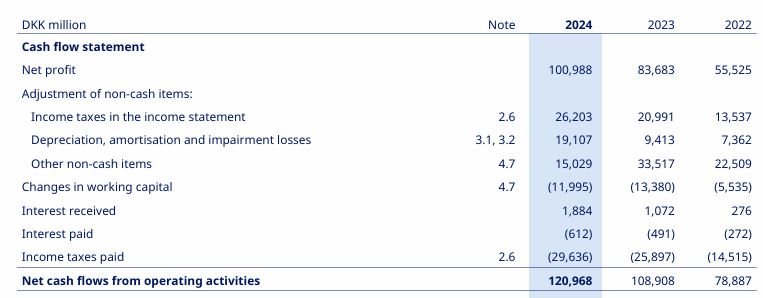
- Cash flow from operating activities continues to rise.
Some have already pulled the ripcord and exited $NOVO B (+2,62 %) exited. My position is already quite large for my individual share positions with a total of 220 shares, so I may well adjust the position size again slightly in the event of a bounce. Let's see what happens after the earnings on May 7?
How do you see Novo? Have you already pulled the ripcord, or do you have strong nerves and are taking advantage of the current price weakness to expand a market leader in the diabetes sector?
@Sebi I would also like to see a picture including RSI and MACD - thanks for pointing this out - I'm sure many people will find it interesting!