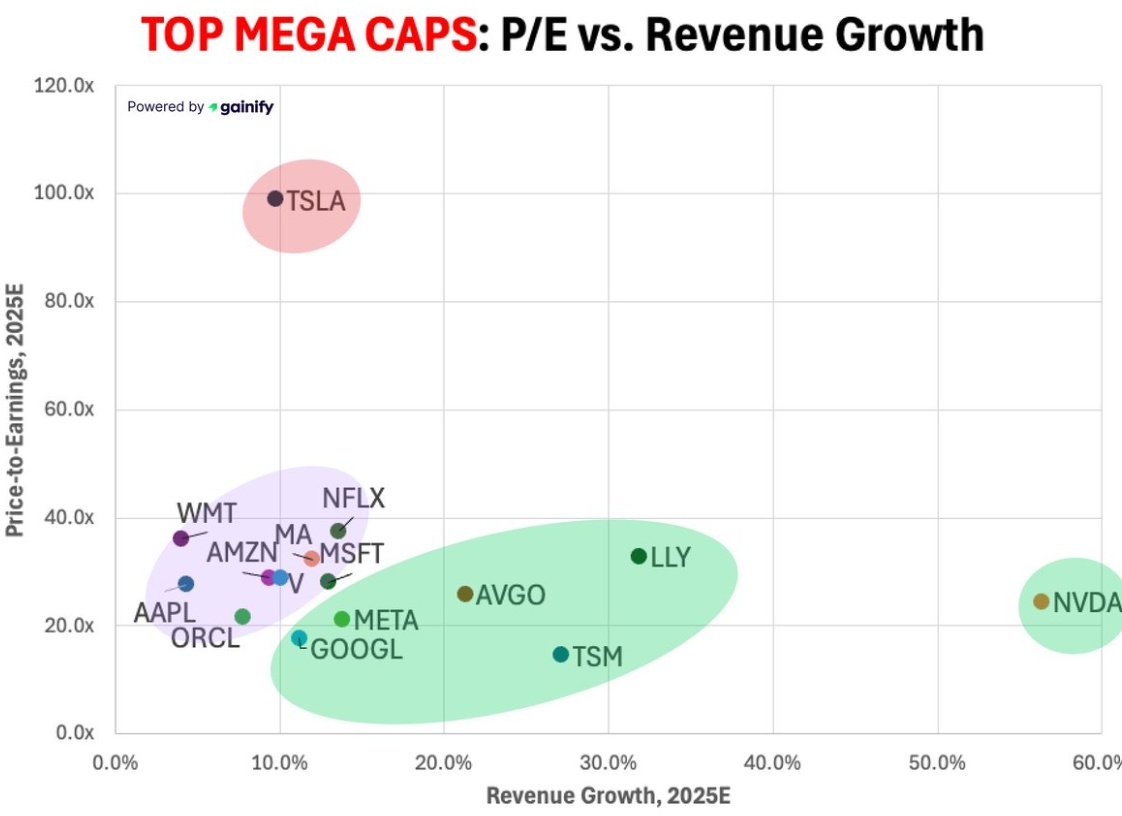
@svenleowe However, the chart shows the P/E but P/E in relation to sales growth. Or to put it another way: Bottom right = lots of growth + cheap = good Top left = little growth + expensive = not so good
To buy this valuation, you have to assume that future growth will be MUCH higher than currently forecast.