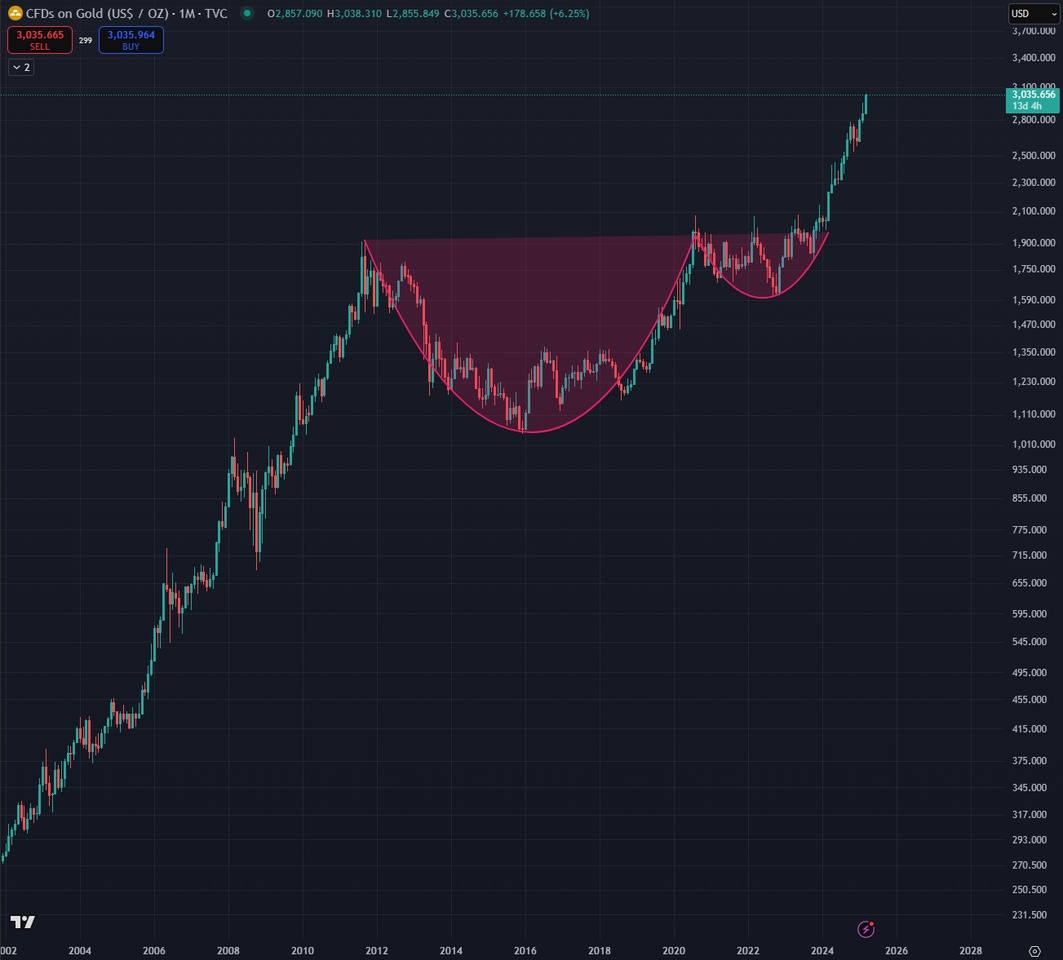
Since gold broke above its previous high from 2020 at the beginning of 2024, it has been soaring.
Major banks have made massive purchases - a clear indication of growing institutional confidence, but also growing skepticism on the market.
📌Historical perspective: inflation and precious metals
Historically, gold and silver have performed particularly well in times of high inflation. While paper money loses value, precious metals traditionally offer security and value retention.
👉 The historical price ratio between gold and silver is also interesting.
Historically, this ratio has usually fluctuated between 15:1 and 80:1, currently it is in the higher range (approx. 89)which suggests that silver has the potential to catch up in the long term.
🆘Gold & silver in stagflation
In stagflation scenarios - economic stagnation combined with high inflation - precious metals have performed above average in the past.
👉 During the stagflation in the USA in the 1970s, the price of gold exploded from around 35 to around USD 850 per ounce.
Currently, many experts see a possible stagflation emerging again, triggered by high national debt, geopolitical tensions and a fragile economic situation.
This could be a catalyst for further price increases in precious metals.
📈Bull market 2025 and beyond?
Fundamentally, there are many reasons for a continuation of the bull market in gold and silver:
- 🪖 Persistent geopolitical uncertainties
- 🆘 Possible stagflation in the USA and Europe
- 📉 High government debt and expansionary monetary policy
- ☀️ Particularly for silver: strong growth in industrial demand from electronics, solar energy and electromobility
The main arguments against this are possible interest rate cuts or a surprisingly strong economic recovery, which could lure investors back into risk assets.
👇 In the following sections, we will now take a look at the charts.
If you are not familiar with chart technology, it is best to skip straight to the conclusion at the bottom
📌 Gold chart

☕Cup-and-handle formation
A cup-and-handle formation is a bullish (positive) chart pattern that often develops over several years. It resembles a cup with a handle and often signals a long-term trend reversal to the upside.
The formation consists of:
Cup: A long, u-shaped recovery that occurs after a sharp price rise and subsequent correction.
Handle: A shorter correction phase after the recovery before the price finally breaks out and ideally starts a long-term bull market.
👉 From 2011 to 2024, gold formed a clear cup-and-handle formation. (Cup: 2011 to 2020 - Handle: 2020 to 2024)
The most recent breakout from this formation in March 2024 could mark the start of a new long-term bull market.
📌 Silver chart

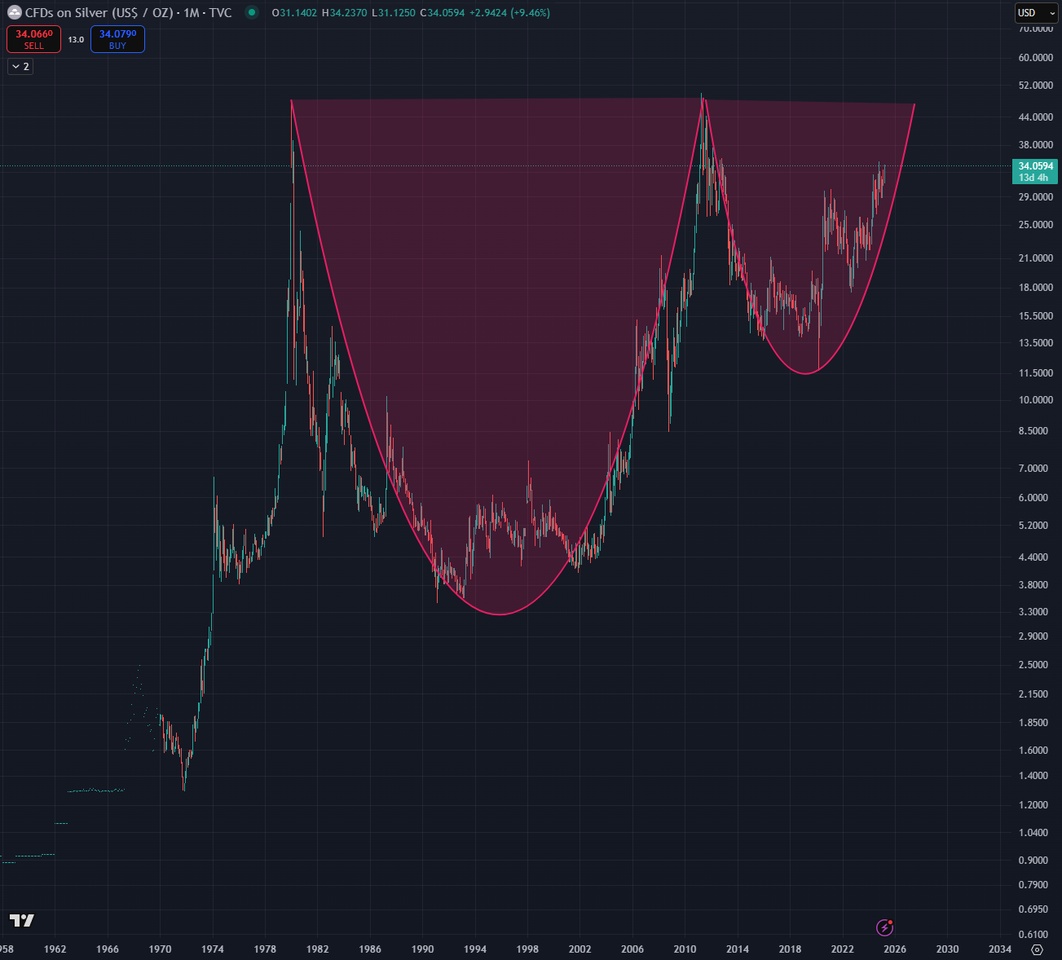
🧐 It is worth taking a long-term look at silver since 1960:
- Silver reached a spectacular high in 1980
- A new high was only just reached in 2011
📈 Silver is currently approaching this all-time high again.
A long-term cup-and-handle formation can also be seen here:
- Cup: 1980 to 2011
- Handle: 2011 to today (possibly completed soon)
👉 Technically, silver may be on the verge of a possible long-term breakout, which is extremely exciting.
📌 Conclusion
I currently see strong arguments for investing in gold and silver in the fundamental data and the technical charts.
Yesterday (18.03.2025) I increased my silver position in $PHAG (+4,34 %) in order to benefit from a potential rally.
I have to say that my investment horizon for gold and silver is very long (20+ years), as I consider precious metals to be the cornerstone of my portfolio.
This is the current composition of my precious metal portfolio:
- GOLD:
$EWG2 (+1,4 %) , $IGLN (+0,02 %) (3.75% of my portfolio) - SILVER:
$PHAG (+4,34 %) (2.40% of my portfolio) - Gold mining ETFs:
$SPGP (+1,99 %) , $GDXJ (+3,62 %) (1.92% of my portfolio) - Individual shares (very speculative):
$BTO (+0,42 %) , $FF (+5,09 %) , $FR (+0 %) (< 1% of my portfolio)
Do you have gold and silver in your portfolio?
If so, what is your weighting?
You might also be interested:
🆘 Crash-Warnsignale & die beste Strategie: Was sagt uns die Vergangenheit?
📈 When in Doubt, Zoom Out – Chart-Tipps für Langfrist-Investoren


