$UBER (+0,19 %)
$KTN (-0,39 %)
$ZAL (-0,39 %)
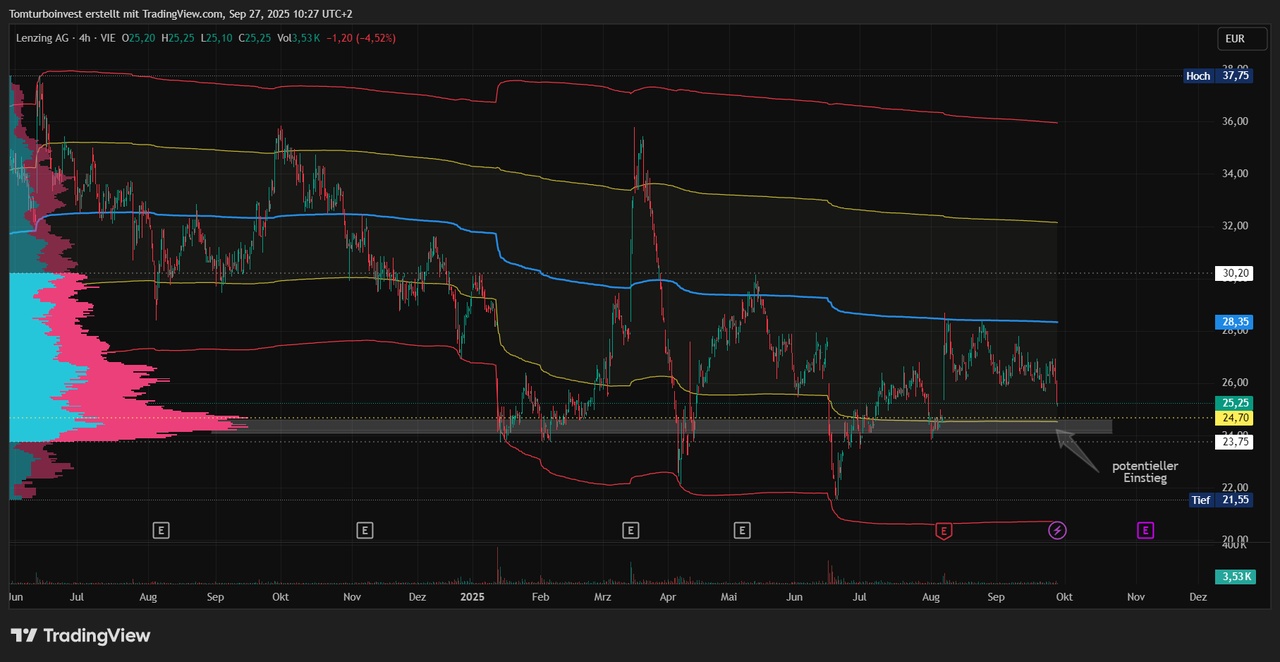
$LNZ (+0 %) a look at 3 current and one potential new swing trade👓
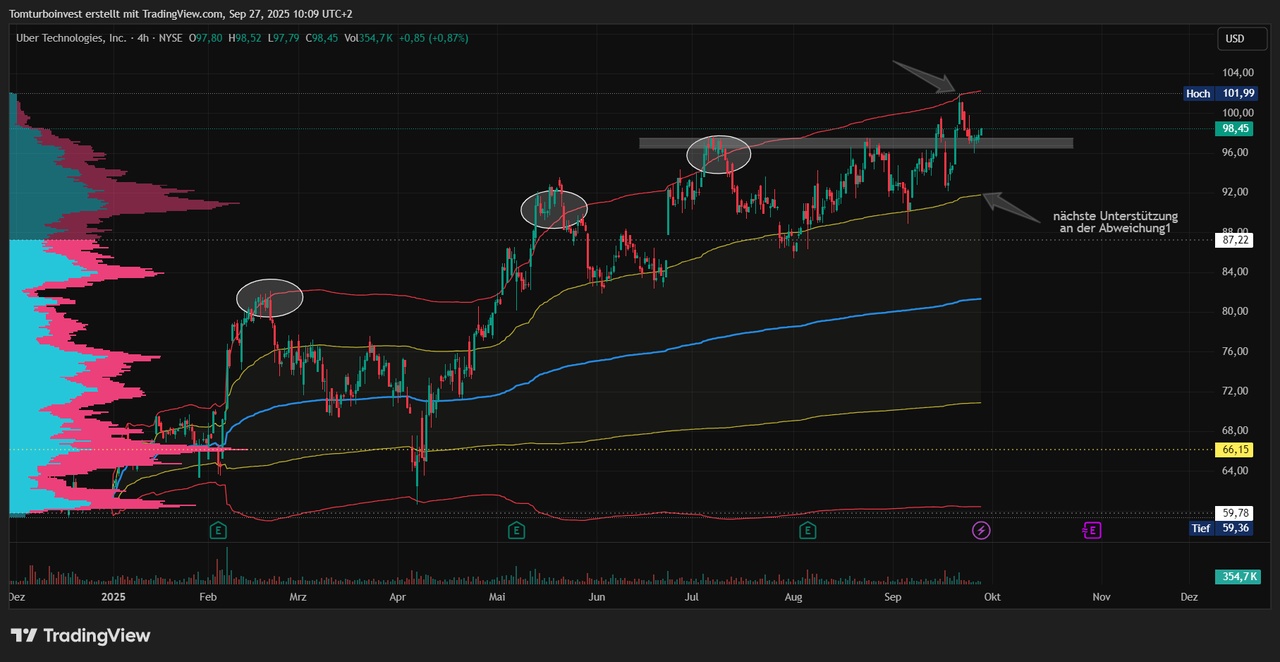
$UBER (+0,19 %) As posted a few days ago, this week the resistance at the deviation2 of the VWAP was once again too strong, BUT a former resistance showed up as support at the end of the week. That would be a good basis for another attempt in the next trading week. It remains exciting😁
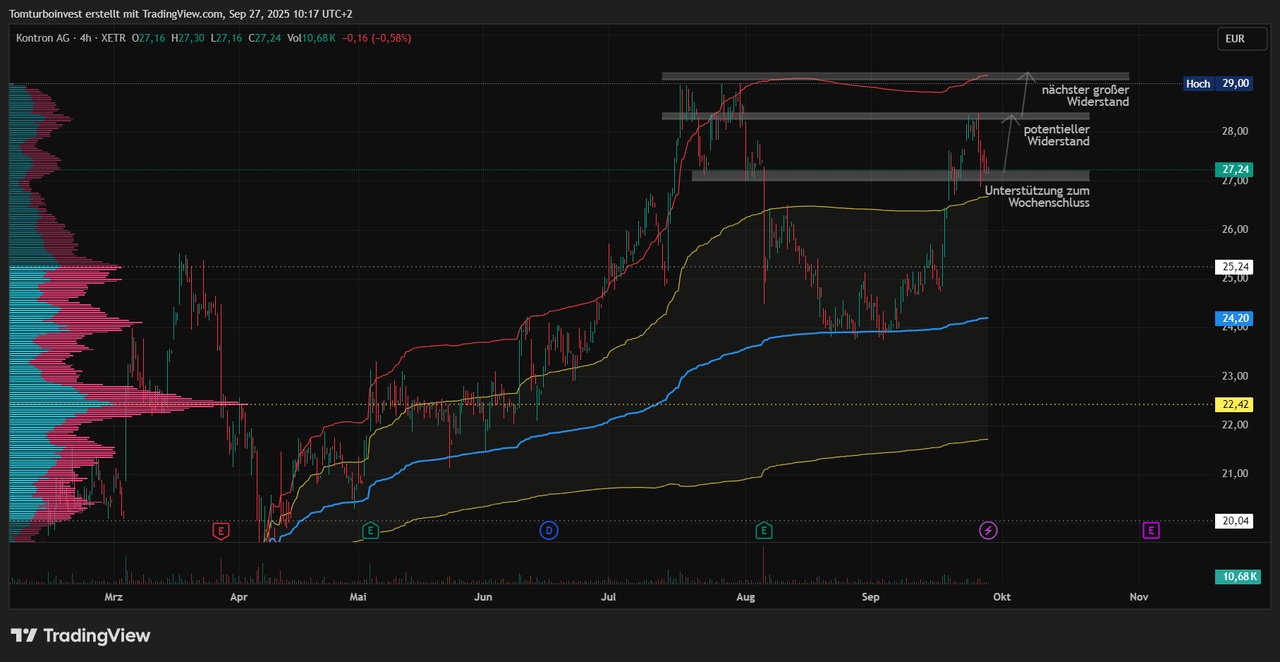
$KTN (-0,39 %) Similar to Uber, Kontron also failed at a technical resistance zone in the course of the trading week. However, a former resistance zone also proved to be support for Kontron at the end of the week. Here, too, a renewed rise could test the resistance upwards and run through to the divergence2 of the VWAP. This divergence2 has been proving to be resistance all year and could not be broken sustainably.
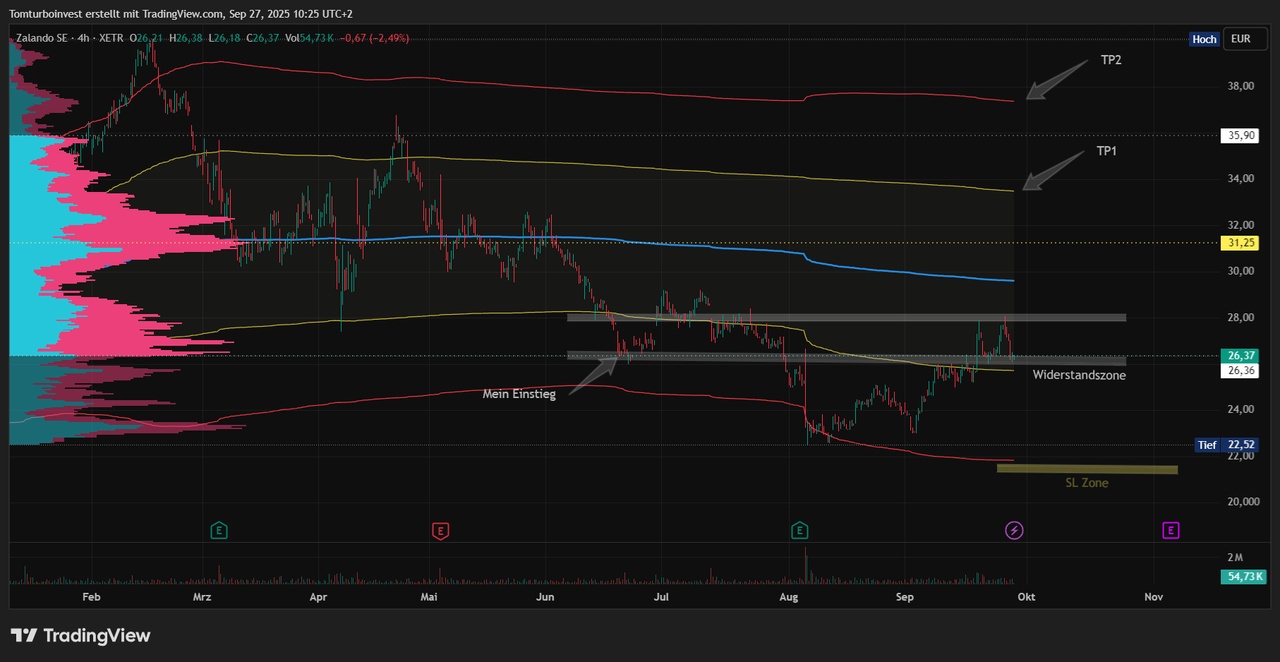
$ZAL (-0,39 %) is also struggling, but a whole "floor" below it😅. The first lower divergence of the VWAP has been a battle zone for Zalando since June. At least a support from June held at the end of the week. Take profit targets remain in place. I currently see the downside risk limited at the divergence2. I.e. my SL is only below this zone.
$LNZ (+0 %) With Lenzing I am again waiting for an entry. When deviation1 is reached, where there is also a HighVolumeNode, I am back in with a first position💰