Eli Lilly - Analysis 📈 (Reading time approx. 10 minutes)
Hello dear GQ forum,
Over the past few days, I have been taking a closer look at the company Eli Lilly $LLY (+1,78 %) as I believe that it could be an exciting buy despite the high share price. 🚀 My analysis compares the quantitative and fundamental financial ratios with those of its competitors. This analysis is less about which drug has how much chance in the future (qualitative analysis), as I have no idea about pharmaceuticals and the like.
The data and the benchmark index (BIEULPVP) are straight from a Bloomberg terminal, so they should be very reliable.
I look forward to your comments and what you think about this stock 🤔
Benchmark index:
Presentation of the company: Eli Lilly
Eli Lilly, founded in 1876 by pharmaceutical chemist and war veteran Colonel Eli, was born out of a need to provide quality pharmaceutical products to the Indianapolis community. Since then, the company has been dedicated to developing effective and safe medicines for the public. Eli Lilly achieved impressive sales in its first year, and its pioneering work in the mass production of pharmaceuticals laid an important foundation for the industry.
A historic milestone was reached with the introduction of insulin in 1920, which changed the lives of diabetics worldwide. The company also played a key role in the mass production of penicillin during the Second World War.
With research and manufacturing facilities in over 55 and 120 countries respectively, Eli Lilly has established a global presence and is able to continually expand its product offering thanks to extensive investment in research and development. The company has made significant advances in various medical fields, including immunology, oncology and diabetes. Of particular note is Eli Lilly's leadership in developing the next generation of insulin treatments and targeted cell therapies in oncology.
Eli Lilly's drug pipeline is characterized by a combination of research, development and strategic acquisitions. Although it is smaller compared to the larger pipelines of pharmaceutical companies such as Novartis, Roche and Pfizer, it still outperforms those of biotech companies specializing in niche markets.
A key measure of success in the pharmaceutical industry is the rate at which drugs progress from the preclinical phase to market approval. Eli Lilly has proven that its pipeline is fertile by successfully developing and launching innovative drugs.
The company, together with Novo Nordisk, has experienced a significant increase in market valuation due to the successful launch of their weight loss drugs. This development positions Eli Lilly and Novo Nordisk as leading players in a new market segment targeting the treatment of obesity, representing a potential annual market volume of over 100 billion dollars.
Like all pharmaceutical companies, Eli Lilly faces challenges such as the risk of clinical trial failures and regulatory hurdles. The probability of approval is particularly low in complex areas such as oncology. Despite these volatile conditions, Eli Lilly remains committed to advancing healthcare through innovation in drug development and strategic partnerships.
Overall, Eli Lilly's history reflects the importance of innovation, strategic growth and a commitment to patient well-being. Through continuous research, development and a focused corporate strategy, Eli Lilly remains at the forefront of pharmaceutical advancement and is a key contributor to improving global healthcare.
Introducing the industry
The pharmaceutical industry is characterized by significant investment in research and development, navigating complex market challenges and adapting to global developments. At the heart of its mission is the goal of addressing unmet medical needs - a task heavily influenced by government regulations, technological advances, intellectual property rights (IP rights) and the trend towards personalized medicine. Companies in this industry are relentlessly deploying large amounts of capital to discover new therapies and drugs, driving this industry forward despite being one of the most highly regulated in the world.
In the USA, the Food and Drug Administration (FDA) is responsible for regulation, while in Europe it is the European Medicines Agency (EMA). The differences in regulations between different regions make it difficult for multinational companies to obtain approvals and marketing rights, especially when they encounter region-specific regulations. Despite major efforts to harmonize international pharmaceutical guidelines, significant differences remain.
The fundamental dynamics of the market, such as the expiry of patents, pricing strategies and entry into new markets, have a decisive influence on the way companies do business. The sector is regularly confronted with patent expiry, which increases the demand for generics and puts pressure on innovators' revenue streams. Generic manufacturers take advantage of such situations to offer low-cost versions of top drugs.
Emerging markets also offer opportunities for growth and expansion, although differences in local regulations and geopolitical instability must be taken into account. When it comes to pricing, it is crucial to strike a balance between the need to recoup the high costs of research and development and offering life-saving treatments at an affordable price. Local governments play a significant role in setting prices and can exert influence both directly and indirectly.
Technologies such as machine learning and artificial intelligence are improving efficiency in drug discovery and patient care. The use of these technologies facilitates the drug discovery process and the conduct of clinical trials.
The advance of biotechnology is also driving the development of personalized medicine, where treatments are tailored to the patient's genetic code, improving treatment efficacy and cure rates.
Collaborations between pharmaceutical companies, public institutions and universities are crucial for success in leading innovation. These partnerships are particularly important in responding to health crises such as pandemics.
Ultimately, the pharmaceutical industry aims to improve overall wellness and combat disease by focusing on gene therapies and personalized medicine to provide more effective treatments that are precisely tailored to patients' individual needs and genetic profiles.
Ratio analysis
Profitability ratios
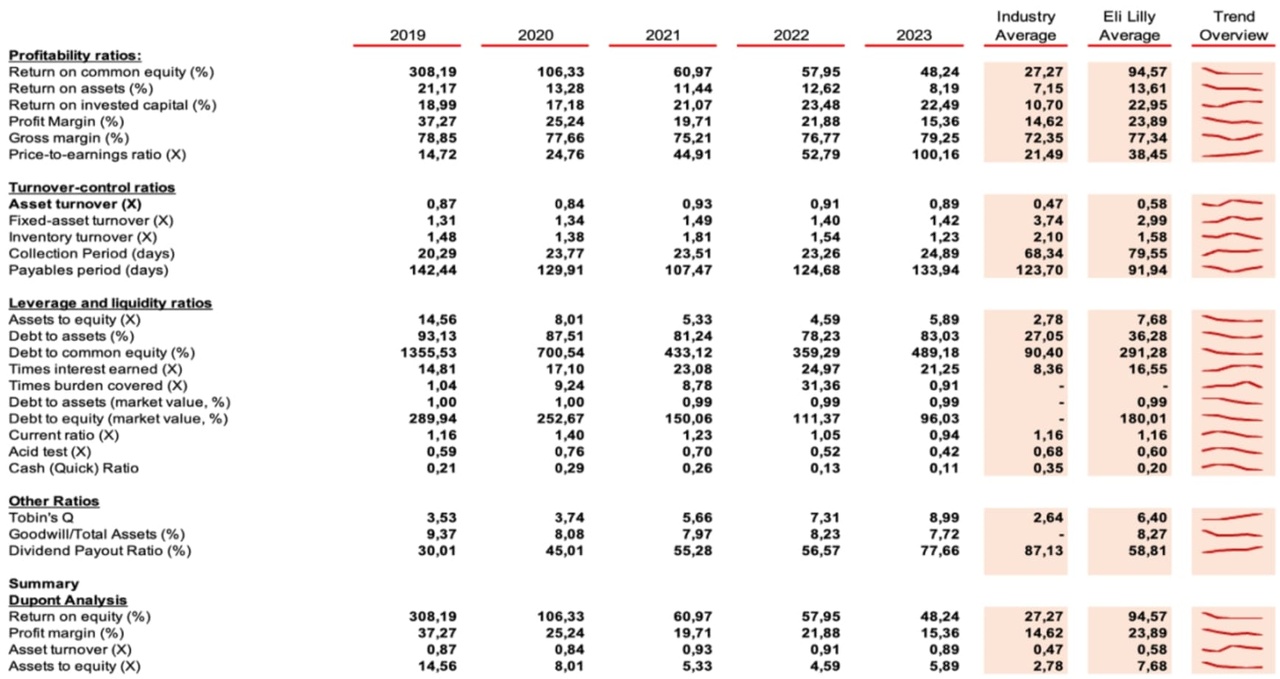
The data outlines a detailed comparison of various profitability ratios for Eli Lilly versus the Bloomberg industry average (BIEULPVP) from 2019 to 2023. Notably, Eli Lilly's return on common equity (ROCE) significantly exceeds the industry average, demonstrating a robust ability to generate profits from shareholders' equity, despite a decline from an exceptionally high 308.19% in 2019 to 48.24% in 2023. Return on Assets (ROA) and Return on Invested Capital (ROIC) also show that Eli Lilly outperforms industry norms, highlighting its efficiency in utilizing assets and capital to generate profits.
However, while Eli Lilly's Profit Margin and Gross Margin ratios consistently outperform the industry, a decreasing trend is observed, particularly in Profit Margin, from 37.27% in 2019 to 15.36% in 2023. The P/E ratio shows a significant increase, indicating a higher market valuation than earnings over the years. Overall, Eli Lilly demonstrates a strong profitability profile, with figures generally above industry averages, highlighting its operational and financial effectiveness over the period.
Turnover-control ratios
The turnover control ratios for Eli Lilly from 2019 to 2023, compared to industry averages, reveal a good insight into the company's operational efficiency.
The Asset Turnover Ratio shows slightly better efficiency of Eli Lilly in generating revenue from its assets, with a slight increase from 0.87 in 2019 to 0.89 in 2023, compared to an industry average of 0.47. This indicates effective asset utilization.
In contrast, the Fixed Asset Turnover Ratio, how well the company uses fixed assets to generate sales, shows an improvement from 1.31 in 2019 to 1.42 in 2023, but remains below the industry average of 3.72, indicating potential for better utilization of fixed assets.
The Inventory Turnover Ratio shows an initial increase, with a peak of 1.81 in 2021, then a decline to 1.23 by 2023, with an overall average below that of the industry of 2.10. This indicates slower inventory management compared to the industry and highlights an area for operational improvement.
The Collection Period, which represents the time to collect receivables, increased to 24.89 days in 2023, well below the industry average of 68.34 days, indicating that Eli Lilly is collecting payments faster than the industry standard.
The Payables Period shows that Eli Lilly pays its suppliers faster than the industry average, decreasing from 142.44 days in 2019 to 133.94 days in 2023, compared to an industry average of 115.20 days. This could indicate efficient supplier payment processes, but also suggests a potential to optimize cash flow by extending payment terms to improve working capital.
While Eli Lilly demonstrates efficiency in asset and receivables management, there are opportunities to further improve asset utilization and inventory turnover to increase operational effectiveness.
Liquidity ratios
The debt and liquidity ratios for Eli Lilly from 2019 to 2023, compared to industry averages, provide a comprehensive overview of the company's financial structure and liquidity position.
Starting with the assets to equity ratio, which measures the company's leverage and indicates how many of the company's assets are funded by equity, Eli Lilly shows a decreasing trend from 14.56 in 2019 to 5.89 in 2023. This is well above the industry average of 2.78 and indicates that Eli Lilly operates with higher leverage than the industry average.
The debt to assets ratio, which shows the percentage of the company's assets that are financed by debt, has decreased from 93.13% in 2019 to 83.03% in 2023. While this indicates a reduction in reliance on debt, it remains well above the industry average of 26.41%, indicating a higher debt to asset ratio compared to the industry.
The debt to common equity ratio, which indicates the extent to which shareholders' equity can cover outstanding debt, shows a significant reduction from 1355.53% in 2019 to 489.18% in 2023. Despite this improvement, the ratio far exceeds the industry average of 90.40% and reflects a higher financial risk.
The times interest earned ratio, a measure of the company's ability to meet its debt obligations, has improved remarkably from 14.81 in 2019 to 21.25 in 2023 and exceeds the industry average of 8.36. This indicates an improved ability to cover interest expenses.
The current ratio and the acid test (quick ratio) provide insights into the company's short-term liquidity. The current ratio has fluctuated widely and ended at 0.94 in 2023, slightly below the industry average of 1.12, indicating a tighter liquidity position. The acid test ratio, which excludes inventories from current assets, also shows a decrease, ending at 0.42 in 2023 compared to the industry average of 0.66, indicating a more restricted liquidity position when inventories are excluded.
Most recently, the cash (quick) ratio has decreased significantly from 0.21 in 2019 to 0.11 in 2023, well below the industry average of 0.31, indicating a lower capacity to cover short-term liabilities with cash and near-cash assets.
In summary, Eli Lilly's debt and liquidity ratios from 2019 to 2023 indicate a company operating with higher leverage compared to the industry, although it has an improved capacity to cover interest expenses. However, the liquidity measures indicate a tighter liquidity position compared to industry peers, with a notable decline in the ability to meet short-term debt obligations with cash and near-cash assets.
Further ratios (for those who haven't had enough)
Eli Lilly's other ratios from 2019 to 2023, which focus on Tobin's Q, goodwill to total assets and the dividend payout ratio, reveal important insights into the company's market valuation, asset management and dividend policy.
The Tobin's Q ratio, which represents the market valuation relative to the replacement cost of assets, increased significantly from 3.53 in 2019 to 8.99 in 2023, outperforming the industry average of 2.64. This indicates strong investor confidence in Eli Lilly's future growth and profitability.
The percentage of goodwill to total assets, which reflects the impact of acquisitions on asset composition, showed a cautious approach with a slight decrease from 9.37% in 2019 to 7.72% in 2023, below the industry average of 8.27%. This indicates a strategic focus on organic growth and prudent acquisition integration (M&A activity).
Eli Lilly's dividend payout ratio increased from 30.01% in 2019 to 77.66% in 2023, but remained below the industry average of 81.31%. This indicates a strategy of balancing dividend payouts with the retention of earnings for reinvestment and aims at long-term value creation and financial stability.
These metrics underscore Eli Lilly's robust market valuation, prudent asset management and strategic dividend policy and position the company for continued growth and enhanced shareholder value.
Growth estimates
The preference for Compound Annual Growth Rate (CAGR) over Average Annual Growth Rate (AAGR) is crucial in the financial valuation targeting growth rates, mainly due to the distortions caused by outliers such as those caused by the COVID-19 pandemic. By using the CAGR, which calculates geometric growth over a fixed period of time, I achieve a more stable and accurate picture of Eli Lilly's growth, highlighting the company's sustained expansion since 2014. This method effectively eliminates short-term volatility, including major disruptions such as the pandemic, and allows for a clearer differentiation between temporary fluctuations and the company's sustained long-term growth trajectory.
The financial analysis presents Eli Lilly's Compound Annual Growth Rates (CAGRs) and highlights prominent trends in key areas of performance. The CAGR from 2014 to 2023 for the sustainable growth rate is 21.00%, demonstrating the company's capacity to grow without significant increases in debt or equity over the last decade. The CAGR for the return on equity (ROE) of 14.48% illustrates a strong annual increase in profitability from a shareholder perspective. At the same time, the CAGR for Return on Invested Capital (ROIC) of 7.74% shows how efficiently the company has generated profits for all stakeholders from its combined capital.
Eli Lilly's future outlook, based on Bloomberg data, shows that 74.2% of analysts have a Buy rating, reflecting significant market confidence in the short term. The short-term forecasts for 2024 and 2025 indicate a considerable return on equity (ROE) of 73.59% and 69.95% respectively, which points to effective profit generation. Furthermore, analysts forecast a 24.26% increase in revenue from 2024 to 2025, accompanied by even more impressive EBITDA growth of 39.75%, underlining Eli Lilly's strong growth potential and operational efficiency in the near future.
Discussion and interpretation
When evaluating pharmaceutical companies such as Eli Lilly, it is essential to understand that financial ratios alone do not reflect the whole picture. A key qualitative aspect that is not reflected in these metrics is the drug development pipeline, a critical factor for future revenue and growth. While my current analysis does not dive deep into the details of Eli Lilly's pipeline, it is significant that the market views the company's pipeline as material relative to peers, as evidenced by the current share price. The valuation of this pipeline has a significant impact on investor expectations, but is outside the scope of my analysis, which focuses more on financial metrics.
Eli Lilly's financial and operational analysis provides a comprehensive view of the company's position within the pharmaceutical industry, highlighting strengths as well as areas for improvement.
The evaluation of profitability metrics shows that Eli Lilly has a remarkable ability to generate profits from shareholders' equity well above the industry average. However, a declining trend in profit margin and gross margin could indicate potential problems in terms of operational efficiency or cost management. Despite these challenges, an increase in the price/earnings ratio indicates a positive market valuation and increased investor confidence.
The analysis shows that Eli Lilly manages assets and receivables efficiently, but there is room for improvement in the utilization of fixed assets and inventory turnover. Compared to industry standards, the company demonstrates greater efficiency in revenue generation from assets, but lags behind in asset utilization and inventory management. This indicates an opportunity to improve these areas to increase operational efficiency.
Eli Lilly shows higher leverage compared to its peers, which presents both opportunities and risks. While higher leverage can increase return on equity in good times, it also increases financial risk. The company's liquidity ratios, particularly the current ratio and quick ratio, indicate a tighter liquidity position than the industry average and signal challenges in meeting short-term obligations without compromising operational capacity.
Conclusion
The DuPont analysis shows that Eli Lilly achieves excellent results in key areas such as profitability, asset utilization and financial management, regularly outperforming industry averages. However, the company still faces challenges, particularly in operational efficiency related to inventory and asset utilization. In addition, debt levels are higher compared to industry peers, which poses potential financial risks.
For Eli Lilly, it is recommended to improve operational efficiencies, take a more prudent approach to debt management and strengthen liquidity positions to mitigate short-term financial pressures. Addressing these key areas could help Eli Lilly to further strengthen its market position and ensure sustainable growth and financial stability. In addition, the focus should be on more efficient inventory management and better utilization of fixed assets. This would give Eli Lilly the necessary agility and flexibility to react to sudden market changes. Although higher leverage can lead to greater returns, it also carries greater risks. It is crucial to maintain a balance between returns and risks to ensure that the company's progression towards higher shareholder returns is not hampered by financial uncertainty. Maintaining strong liquidity is essential to ensure stability in times of market volatility and to secure investor confidence and the company's continued existence. A commitment to these strategic objectives will strengthen Eli Lilly's competitiveness and further enhance its leadership position in the pharmaceutical industry and in innovation.
This report highlights Eli Lilly's impressive achievements and strategic challenges and emphasizes the importance of financial analysis in making informed strategic decisions. By applying these insights, Eli Lilly can effectively mitigate risks in the global pharmaceutical landscape, take a leadership role in the development of innovative treatments in personalized medicine, and thus make a significant contribution to social well-being.