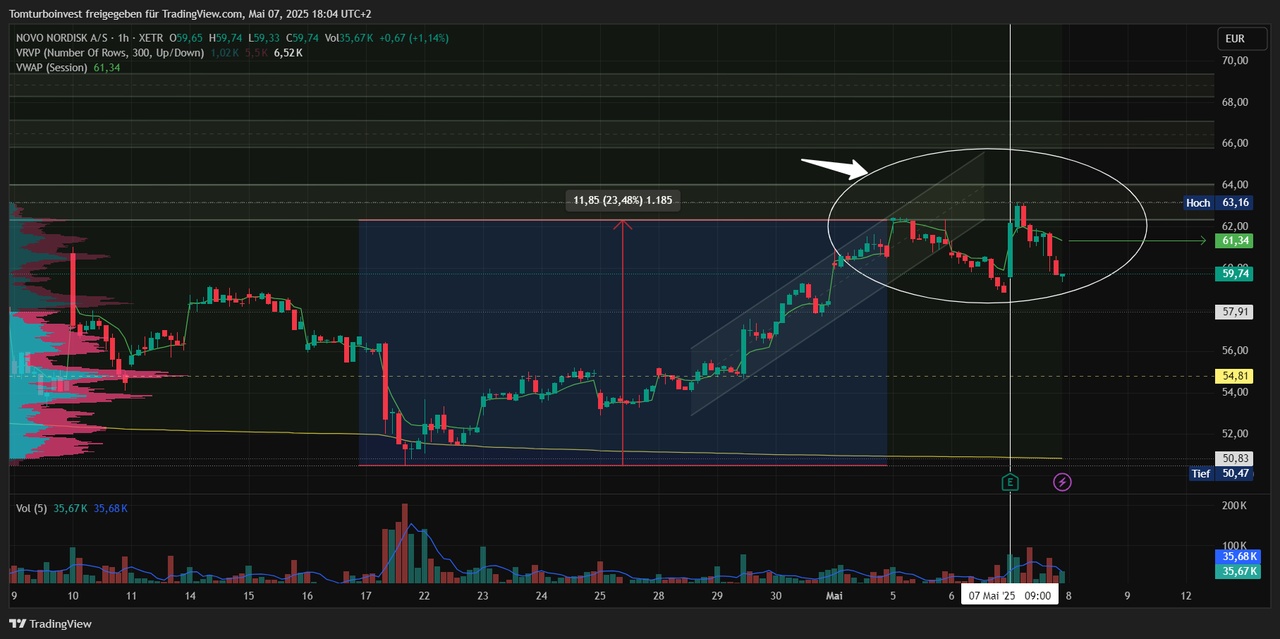
$NOVO B (+1,18 %) A final chart analysis on earning day. The spook is over - In the chart you can see the last few days in the 1h chart in the focus area of the white ellipse.
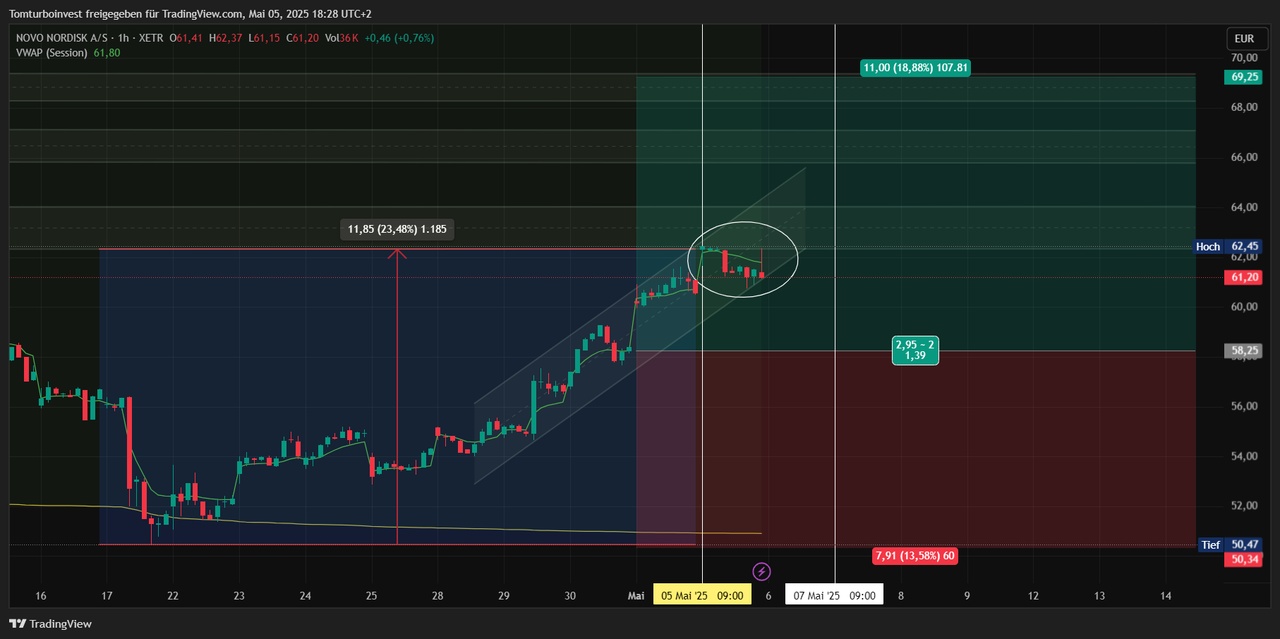
As already known, Novo ran up to the first resistance zone (Monday, May 5), from then on it became difficult - the buying interest decreased, and traders who used the entry at the lower edge of the VWAP also sold again.
Today's figures then provided a strong boost in the first two hours of trading. Things then got tough again pretty much in the middle of the resistance zone at €63. Volumes dropped - we ended up at €59.74 at the XETRA close - today's volume-weighted average price was €61.43 (green arrow).
So, that's it for the rest of my $NOVO B (+1,18 %) analysis. I am still confident and also glad to have increased my position again at 50. Now it's time to be patient. Over the next few days and weeks, we will see whether the many good analyst ratings, some with "overweight" recommendations, can attract a lot of new capital again.