$UBER (+1,38 %) Why I sold my Uber right after the start of US trading today.
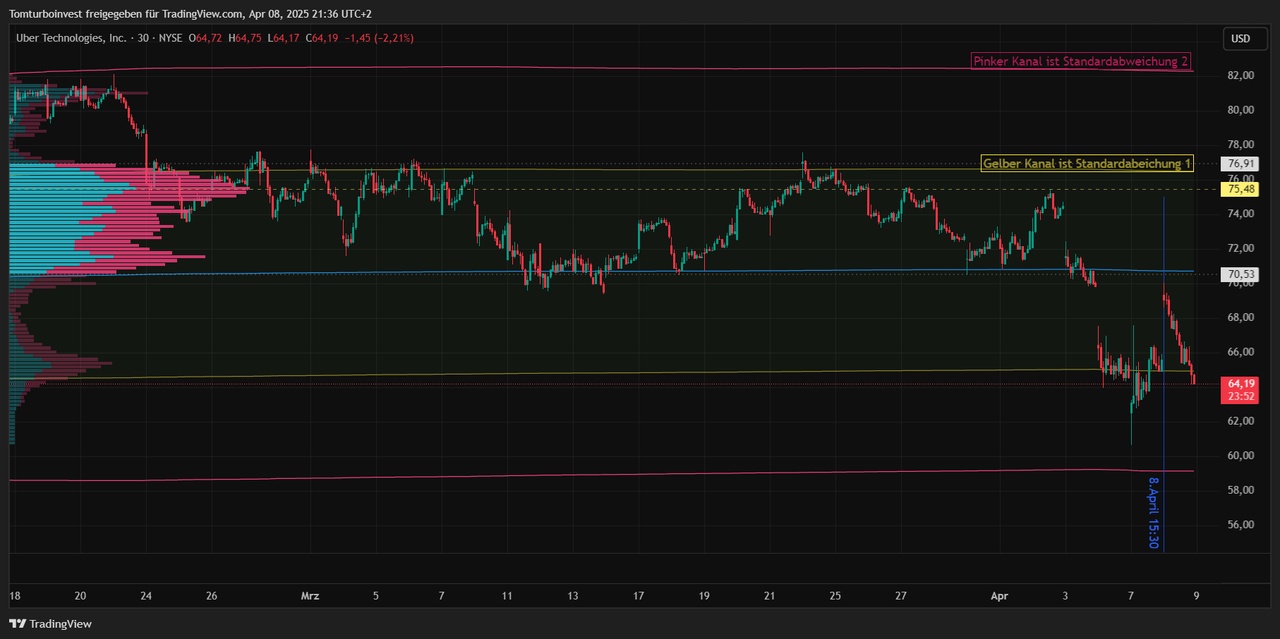
Trump's actions and share prices are not predictable in themselves, but when share prices react to them, they remain within certain ranges - for mathematicians and statisticians - it's about the standard deviation 1 and 2. I use these marks in addition to the volumes for my trading decisions, among other things.
The picture below shows a short time horizon of approx. 3 weeks, 30min chart on the NYSE. The yellow channel shows the standard deviation from the volume weighted average price - blue line in the middle. The pink channel shows the standard deviation 2.
Even though Trump is a "savage", the price is running within the standard deviation 1 except for a few outliers. If it breaks down sharply, I am on the lookout for a reversal signal or place a buy order in this area.
As the price has moved south again from the average price since the US stock market opened today, that was the sell signal for me - even if the buy-in of just under €56 would have been tempting to hold.
With high volatility, it's better to get out and lock in profits. You can always get back in. Let's see what the news has to offer tomorrow. Buy orders are set at the lower end of the standard deviation 2 / yesterday's lows. If it works, it's good, if not, also OK, then at least I have secured the profits from "yesterday to today".
Of course, the chart does not give us 100% certainty! But it does give us signals for buy or sell - if the price were to break out of the standard deviation 2 downwards, for example, my stop loss would also solve the problem 😅
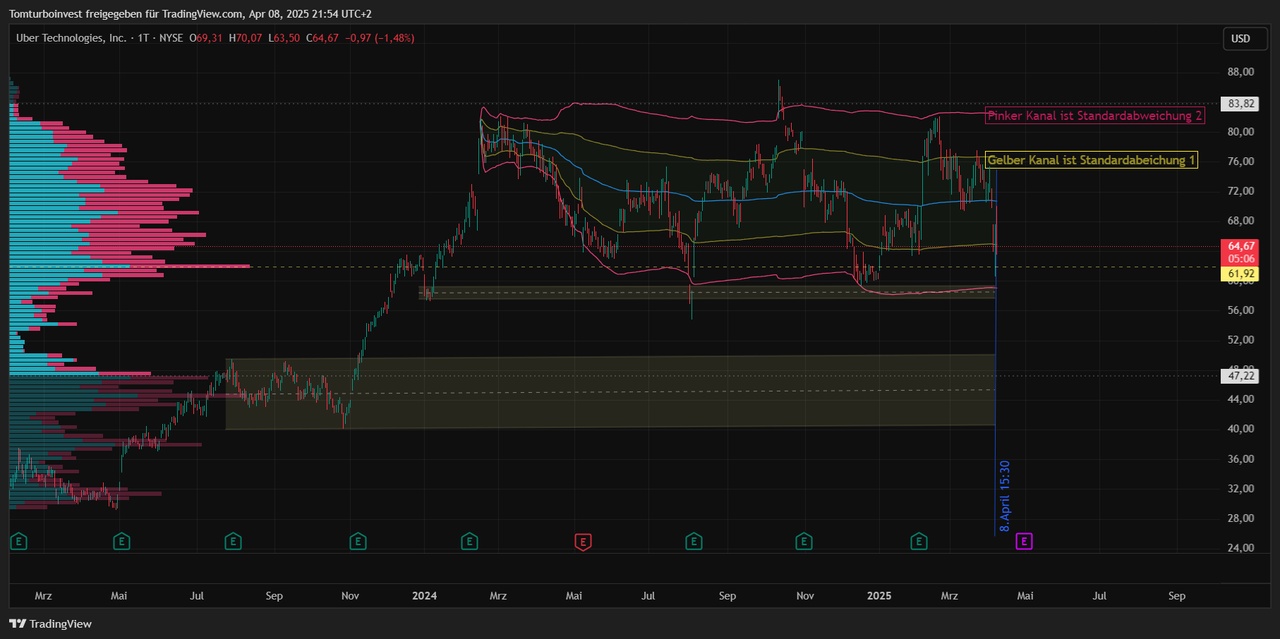
If all else fails, then "zoom out" - where are the relevant areas on the long horizon?
There used to be something at the lower edge of standard deviation 2 😅 - otherwise there may be potential downwards into the channel between 40$ and 50$ 🥶 ...let's hope we don't have to see that!