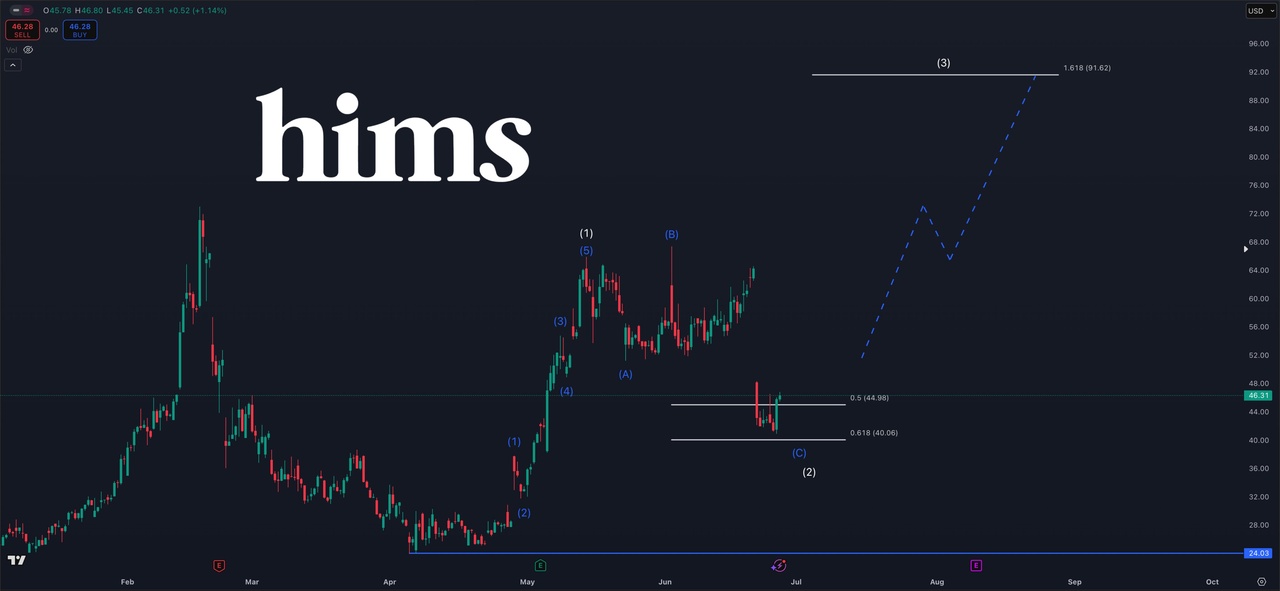
Due to the post from @Aktienfox about $HIMS (+0,95 %) here is a little insight into the Elliot Wave principle.
About EWP:
In the 1930s, the former successful accountant Ralph Nelson Elliott developed a theory about price movements on stock markets based on the Dow Theory developed by Charles Dow and the Fibonacci number sequence. Even today, the Elliott Wave Principle is still highly regarded by many technically oriented investors. The basic statements of the theory are examined in two episodes.
Elliott began his systematic studies in the early 1930s using many decades of price history from share and index charts. He examined time units ranging from half-hourly charts to annual charts and came to the conclusion that price movements were only seemingly random and unpredictable. In fact, according to Elliott, they followed "natural laws" and could be predicted using the Fibonacci number series. The sequence of numbers named after the important Italian mathematician Leonardo da Pisa - alias Fibonacci - has interesting mathematical aspects and occurs frequently in nature. Elliott published his findings in two books ("The Wave Principle", 1938, and "Nature's Law - The Secret of the Universe", 1946). However, the theory only became widely known after the findings were summarized in the book "Elliott Wave Principle" by A. J. Frost and Robert Prechter in 1978 and after Robert Prechter, a psychologist by training and former Merrill Lynch analyst, became widely known for several correct predictions of major trend reversals in the 1980s and for winning the US trading championships in 1984.
Key aspects
The wave theory essentially contains three relevant aspects: Formations, length ratios and time ratios. Formations are the most important, followed by length ratios and time ratios.
The formations deal with the aspect of wave patterns that can be identified in the course of the price according to certain rules and guidelines. The length ratios deal with the question of the price ratios between the individual categorized waves. These ratios are used in practice to determine potential price targets in the correction (retracements) and in the trend (projections or extensions).
Even many technical analysts, who tend to have reservations about Elliott wave theory, often use this aspect in their analyses independently of formation theory. In turn, time relationships are also largely neglected by Elliott followers due to their perceived low reliability. They are also derived through the use of Fibonacci ratios and can serve to confirm the analysis of formations and price targets.
Central statements
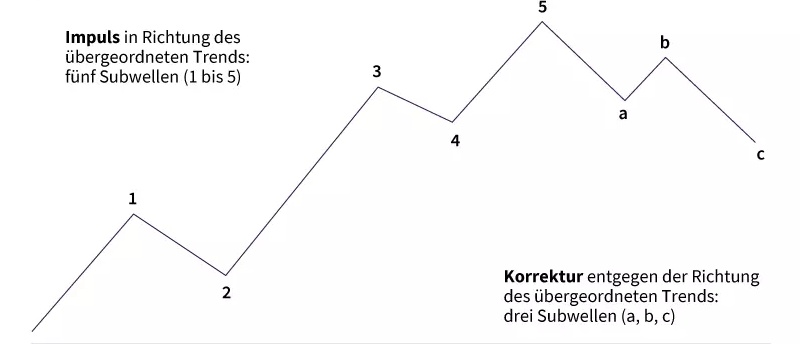
The most important thesis of the Elliott Wave Theory states that the financial markets follow a fixed eight-wave cycle of five impulse waves in the direction of the trend and then three correction waves in the opposite direction. The impulse waves are labeled with the numbers 1 to 5, while correction waves are identified by the letters a, b and c. There are different ranks or sizes of trends. Elliott himself categorized nine ranks according to the data available to him, ranging from a few hours to around 200 years. Due to the fractal nature of the markets, the theory follows that each wave is part of a wave of the next higher rank and can itself be subdivided into waves of the next lower rank. The aforementioned eight-wave structure is always maintained. This means that as the waves or cycles are subdivided more and more precisely, the wave sequences 1, 2, 3, 5, 8, 13, 21, 34, 55, 89 etc. are obtained, which represent nothing other than the Fibonacci number sequence. Whether a wave is divided into three or five waves depends on the trend direction of the next largest wave - i.e. the next highest rank. The only exception is triangles, which correct an impulse, i.e. a trend wave, into five sub-waves.
Impulse waves
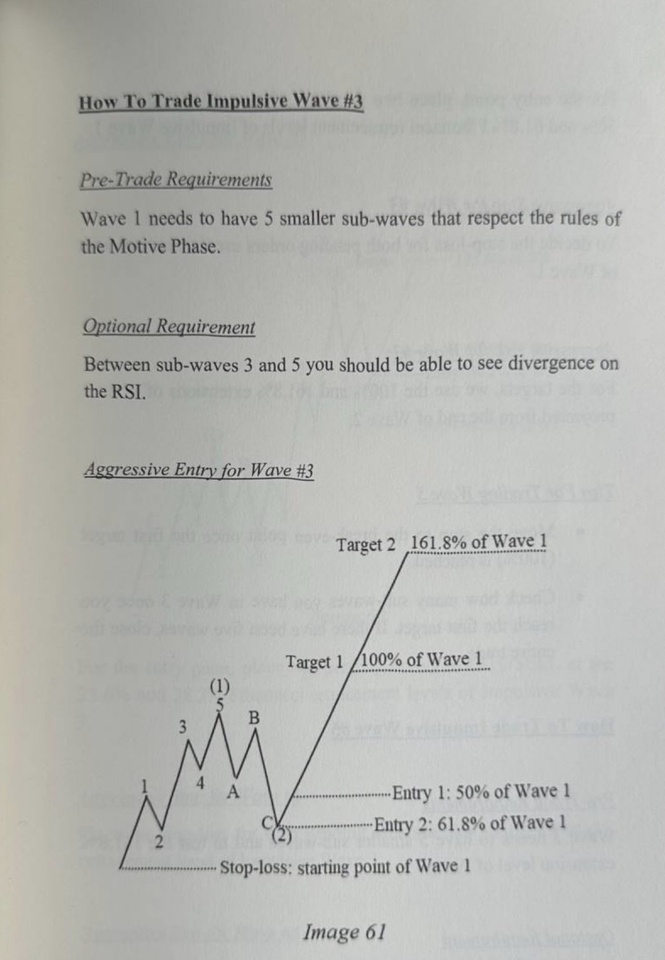
An impulse wave in the direction of the trend can always be divided into five sub-waves. Wave 1 must always be an impulse wave or a so-called Leading Diagonal Triangle (LDT), in which the boundary lines converge. Like the impulse wave, the LDT consists of five sub-waves. With the latter, however, there is a price overlap between wave 1 and wave 4, whereas this is not permitted with the impulse wave. Wave 2 is a corrective wave of wave 1 consisting of three waves and must not reach 100% of the low of wave 1. Wave 3 then represents another impulse wave and must never be the shortest of the five waves. Wave 4 is again a corrective wave, which is either a three-wave wave or a triangle consisting of five sub-waves. With the exception of the LDT (see chart 1), wave 4 must not lead the price curve back into the territory of the preceding wave 1. Wave 5 must be an impulse or a so-called Ending Diagonal Triangle (EDT). In an EDT, the boundary lines converge and there is a price overlap between sub-wave 4 and sub-wave 1. Unlike the LDT, however, the five sub-waves consist exclusively of corrective waves, resulting in a 3-3-3-3-3 sequence instead of a 5-3-5-3-5 sequence. With regard to the guidelines for impulse waves, it should be noted that, as a rule, one of the three impulse waves has an extension in the direction of the trend, i.e. is significantly longer in price than the other two. In the equity markets, this is usually wave 3, while in the commodity markets it is often wave 5. The individual impulse waves are usually in a Fibonacci ratio to each other. An extended impulse wave often reaches 161.8 percent of the length of the other impulse waves. Other frequently encountered degrees of extension are 200 percent and 261.8 percent. If an impulse wave expands - especially wave 3 - the other two waves in the direction of the trend are often roughly the same length. If there is an extension in wave 5, a possible price target is obtained by projecting 161.8 percent of the distance from the low (in the uptrend) of wave 1 to the high of wave 3 at the low of wave 4 upwards. Furthermore, a weakening of the trend dynamics (momentum) and a decline in trading volume can usually be observed during the formation of wave 5.
Corrective waves
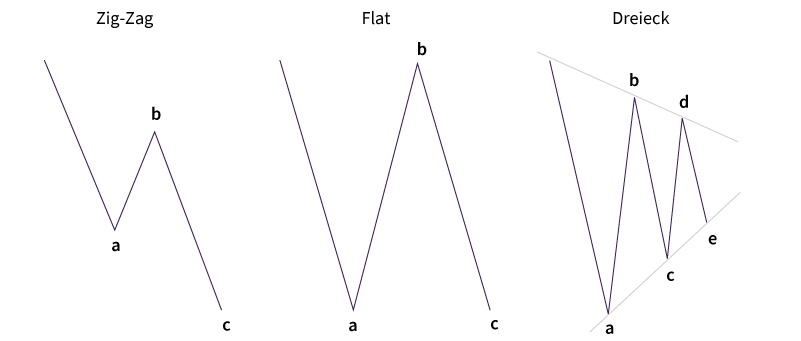
The corrective waves can be divided into the forms zig-zag, flat and triangle as well as combinations of these three (complex correction). The three-wave Zig-Zag correction pattern has a 5-3-5 wave structure. This means that the first wave a - running in the direction of the correction trend - can be divided into five sub-waves. The subsequent wave b in turn corrects wave a in three waves and may not reach the starting point of wave a. This is followed by the five-part wave c in the direction of the correction trend. The latter runs beyond the end point of wave a. The three-wave flat correction pattern represents a more sideways correction and has the wave sequence 3-3-5. Wave a, like wave b, is therefore three-wave, followed by a five-wave c-wave. The five-wave triangle - usually occurring with converging boundary lines (contracting triangle) - has the wave structure 3-3-3-3-3-3 and is labeled with the letters a, b, c, d, e. It occurs as wave 4 of an impulse movement. It occurs as wave 4 of an impulse movement or as sub-wave b of a simple corrective formation (zig-zag or flat). It can also be a component of more complex corrective formations, but this would go too far in this context. In general, it can be said of corrective waves that they usually correct the preceding trend movement in a Fibonacci ratio (Fibonacci retracement) in accordance with the Elliott wave principle before the trend continues. Typical retracement levels are 23.6 percent, 38.2 percent, 50 percent, 61.8 percent and 76.4 percent/78.6 percent. Corrective wave 2 often corrects 50 percent or 61.8 percent of wave 1, while wave 4 tends to retrace 23.6 percent or 38.2 percent of wave 3. According to the so-called Rule of Alternation, it is unlikely that the same form of correction will occur twice in succession as part of an impulse movement. So if a zig-zag develops in wave 2, it is to be expected that wave 4 will form as a flat or triangle. As with the impulse waves, there are also target projections from the ratio of the sub-waves of the correction. The most important guideline is that wave c of a zig-zag formation is often just as long as wave a in terms of price.
Source: Société Générale (Ralf Fayad)