the Piotroski F-Score acts as a quality indicator to find the highest quality value stocks and to subject cheap stocks to a quality check. Backtests show an astonishing outperformance if the Piotroski F-Score had been taken into account when investing in value stocks over the last 50 years. In this article, I would therefore like to explain the scoring system and then present three exciting quality stocks that came to my attention due to their high score.
How does the F-Score work?
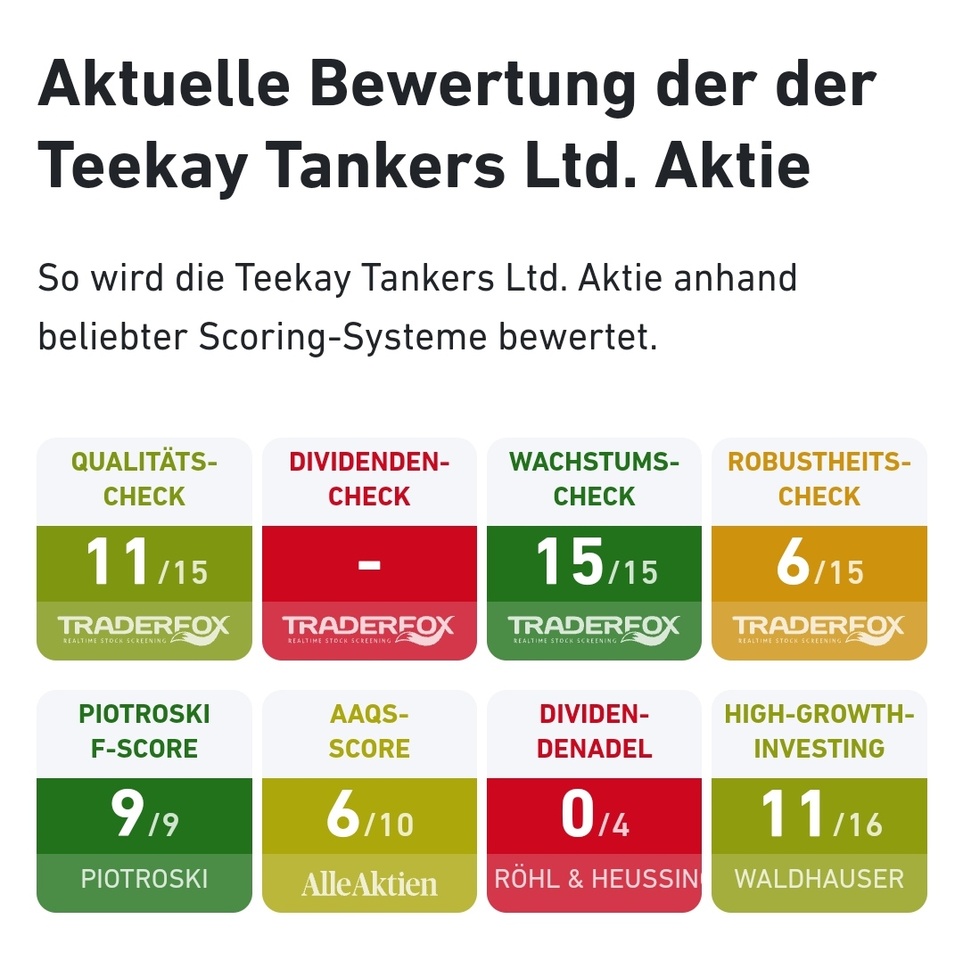
The Piotroski F-Score was developed by accounting professor Joseph Piotroski from Standford University. The nine defined points are based on accounting results over several years. If the respective criterion is met, the share is awarded one point. Shares with a score of 8 or 9 are considered particularly strong, whereas a score of 0 to 2 may even indicate imminent insolvency.
However, it should be borne in mind that the scoring is not applicable to all types of companies - in the case of growth stocks, one should therefore not draw a general conclusion about the poor quality of the company on the basis of a weak Piotroski score alone. Nor can the scoring be seen as the sole indicator for buying, as it does not take into account the valuation of the share. However, it is very suitable as inspiration or as part of an analysis of value stocks. Piotroski also developed scoring as an addition to a valuation method, but not as the sole indicator.
Piotroski tested the F-Score in the period from 1976 to 1996 and the result was an astonishing outperformance of around 7.6% per year! More recent backtests confirm the outperformance. It is therefore worth taking a closer look at the system. Piotroski divides the nine scoring points into three categories. The key figures relate to the entire financial year:
Profitability
Positive return on assets (ROA): ROA is the ratio of net profit for the year to total capital. A positive net profit would therefore fulfill this criterion.Positive operating cash flow: The company has received cash and cash equivalents from operating activities.Increasing return on assets: Profitability based on ROA has improved compared to the previous year.Operating cash flow > net income: This criterion is used because cash flow cannot be influenced by accounting tricks as easily as net income.
Debt, liquidity and financing
Debt is falling: The debt ratio has fallen/the equity ratio has risen compared to the previous year.Liquidity increases: 3rd degree liquidity (current ratio) is higher than in the previous year: the ratio indicates the relationship between current assets and current liabilities. The higher the 3rd degree liquidity, the lower the risk of having to pay current liabilities from the company's assets.No raising of new equity: The number of shares outstanding is the same or less than in the previous year. There was no dilution through capital increases in the past year.
Operational efficiency
Increasing pricing power: The gross margin has increased compared to the previous year.Productivity increases: Capital turnover (asset turnover) increased compared to the previous year. Asset turnover is the ratio of turnover to total assets. The higher the value, the better, as a low turnover with a high balance sheet total indicates low efficiency.